

 English
 Deutsch
News
Home / News / Industry News / How to Measure Harmonic Distortion: Practical Steps, Sensors, and Limits
Most harmonic problems are misdiagnosed long before they are corrected. Picture a plant where one transformer runs hotter than its identical twin, a feeder shows 120 A in the neutral while each phase carries only 60 A, and a capacitor bank has failed twice in 18 months. The maintenance team measures 4.2 percent total harmonic distortion, sees that it sits under the 8 percent limit used for low-voltage buses, and files the case as normal.
The conclusion first: harmonic distortion is not a single number you read off a display. Voltage distortion is measured at a busbar with a Class A analyzer over defined windows, and harmonic current is measured per feeder with a sensor that stays accurate at the harmonic orders you care about. Miss either half and the data will send you toward the wrong fix.
Voltage THD is the rms sum of harmonic components from the second order up to a defined cut-off, divided by the fundamental component and expressed as a percentage. The cut-off is part of the definition, so a figure quoted to the 25th order cannot be compared directly with one quoted to the 50th. Current distortion is normally reported as a spectrum rather than one figure, because acceptance criteria are set order by order and judged against the demand load current, which is TDD rather than THD.
Two practical consequences follow. Voltage distortion describes the supply; harmonic current describes the load that is polluting it. And on a four-wire system, triplen orders such as the 3rd, 9th and 15th add arithmetically in the neutral instead of cancelling, so a feeder can pass every phase-current check and still overheat its neutral conductor.
| Measurement | Where it is taken and what it is judged against | Minimum instrument capability |
|---|---|---|
| Voltage THD | LV main busbar or point of common coupling; 8 percent at or below 1 kV and 5 percent from 1 kV to 69 kV under IEEE 519 | Class A analyzer with 10-minute aggregation |
| Individual voltage harmonics | Same busbar, order by order; the 5th and 7th are usually the tightest | Spectrum to at least the 50th order |
| Current TDD per feeder | Feeder or incoming breaker; limits scale with the short-circuit ratio at the coupling point | Current sensor with a flat response to order 25 or higher |
| Neutral current | Neutral of every four-wire feeder; compared with conductor rating, not a percentage | Channel that retains triplen orders |
A 4 percent voltage THD paired with a 60 percent current TDD on a single feeder is a resonance signature, not a compliance pass. Always report the two numbers together.
Standards define accuracy for distorted waveforms, not for clean sine waves. IEC 61000-4-30 Class A is the level to specify when results may be disputed or used for contractual compliance; Class S is a lower-cost option for statistical surveys. IEC 61000-4-7 defines how harmonics are grouped, and the two documents are meant to work together.
At least 256 points per cycle with a proper anti-aliasing filter, so high-frequency noise cannot fold back into low-order bins and inflate the result.
Rectangular 10-cycle (50 Hz) or 12-cycle (60 Hz) windows, aggregated into 10-minute and 2-hour values. Single-cycle values are not comparable with a 10-minute limit.
The 50th order as a baseline, extended to 5 kHz or 9 kHz when interharmonics, ripple control signals or high-order distortion matter.
Time synchronization belongs on the same list. Without a common clock, you cannot prove that a distortion peak at 14:20 came from a drive starting up rather than from a capacitor bank switching two rooms away. A multifunction meter that prints one THD figure per second is a useful trend indicator, but grouping, windowing and filtering are what make a reading defensible.
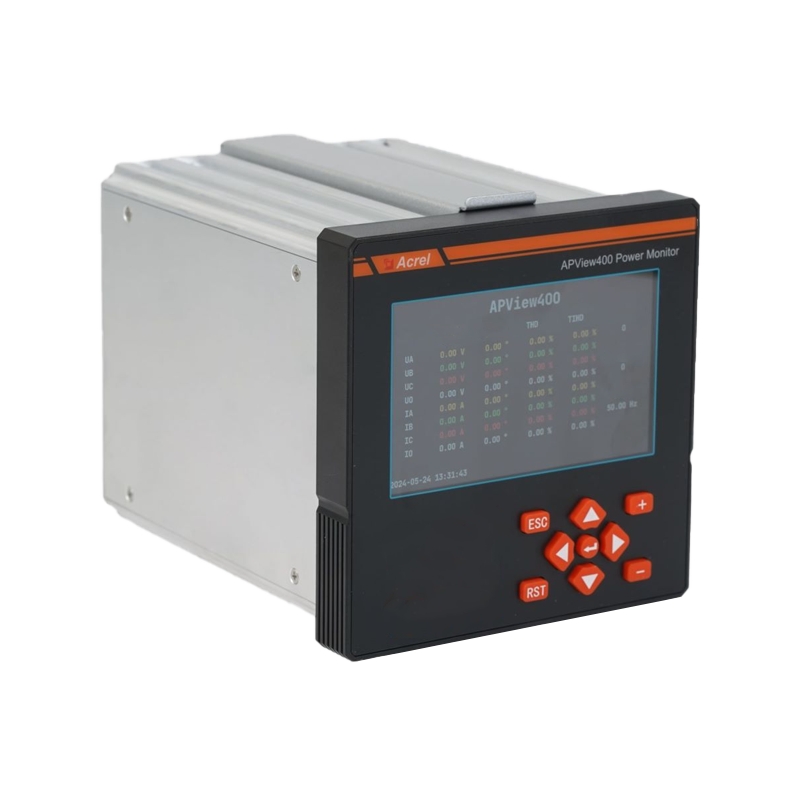
 APView400 Class A Certificated Power Quality AnalyzerThis Class A analyzer records disturbance waveforms, direction, and event sequences, making it suitable for detailed harmonic and power-quality investigations.View Product →
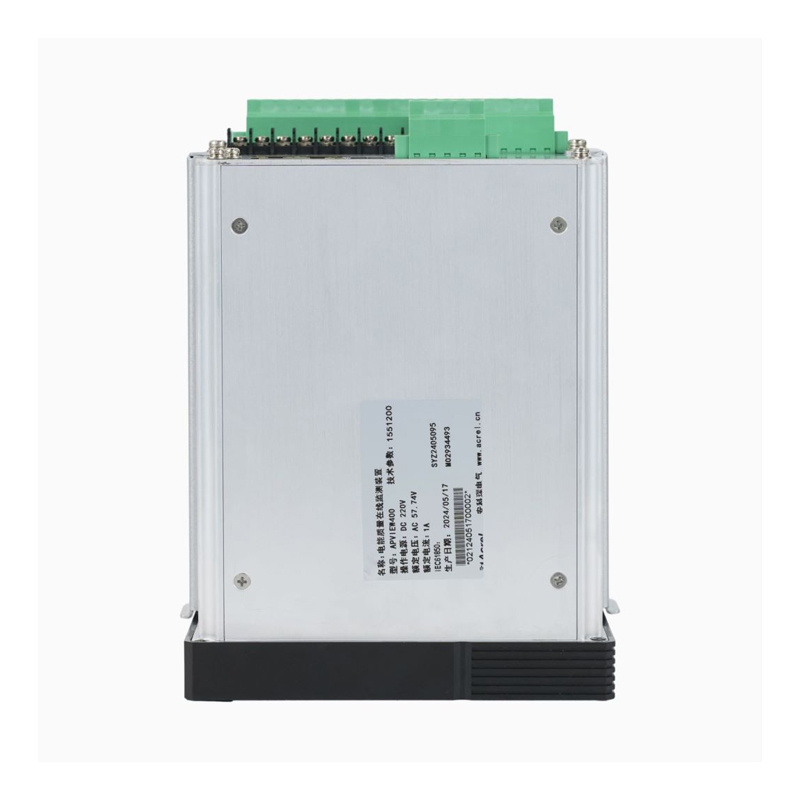
An instrument built for this job, such as a Class A power quality analyzer, records the spectrum, the window and the waveform snapshot together, which is exactly what a harmonic investigation needs.
General-purpose current transformers are designed to reproduce the fundamental accurately and cheaply. Ratio error stays small, but phase error grows with frequency, and by the 25th harmonic a standard CT can be several degrees out. That is tolerable for magnitude readings and dangerous for harmonic power direction: when the true harmonic power is close to zero, a few degrees of channel phase error is enough to flip the sign, and you end up blaming the wrong side of the transformer.
Watch the secondary burden and lead length as well. A long run into a high-burden input pushes the phase response further away from the datasheet curve, and an undersized split-core CT with an air gap behaves differently from a solid-core unit. Sensors based on an air-core coil avoid saturation and hysteresis and hold a much flatter response across the harmonic range, at the cost of a matching integrator and a higher price per channel.
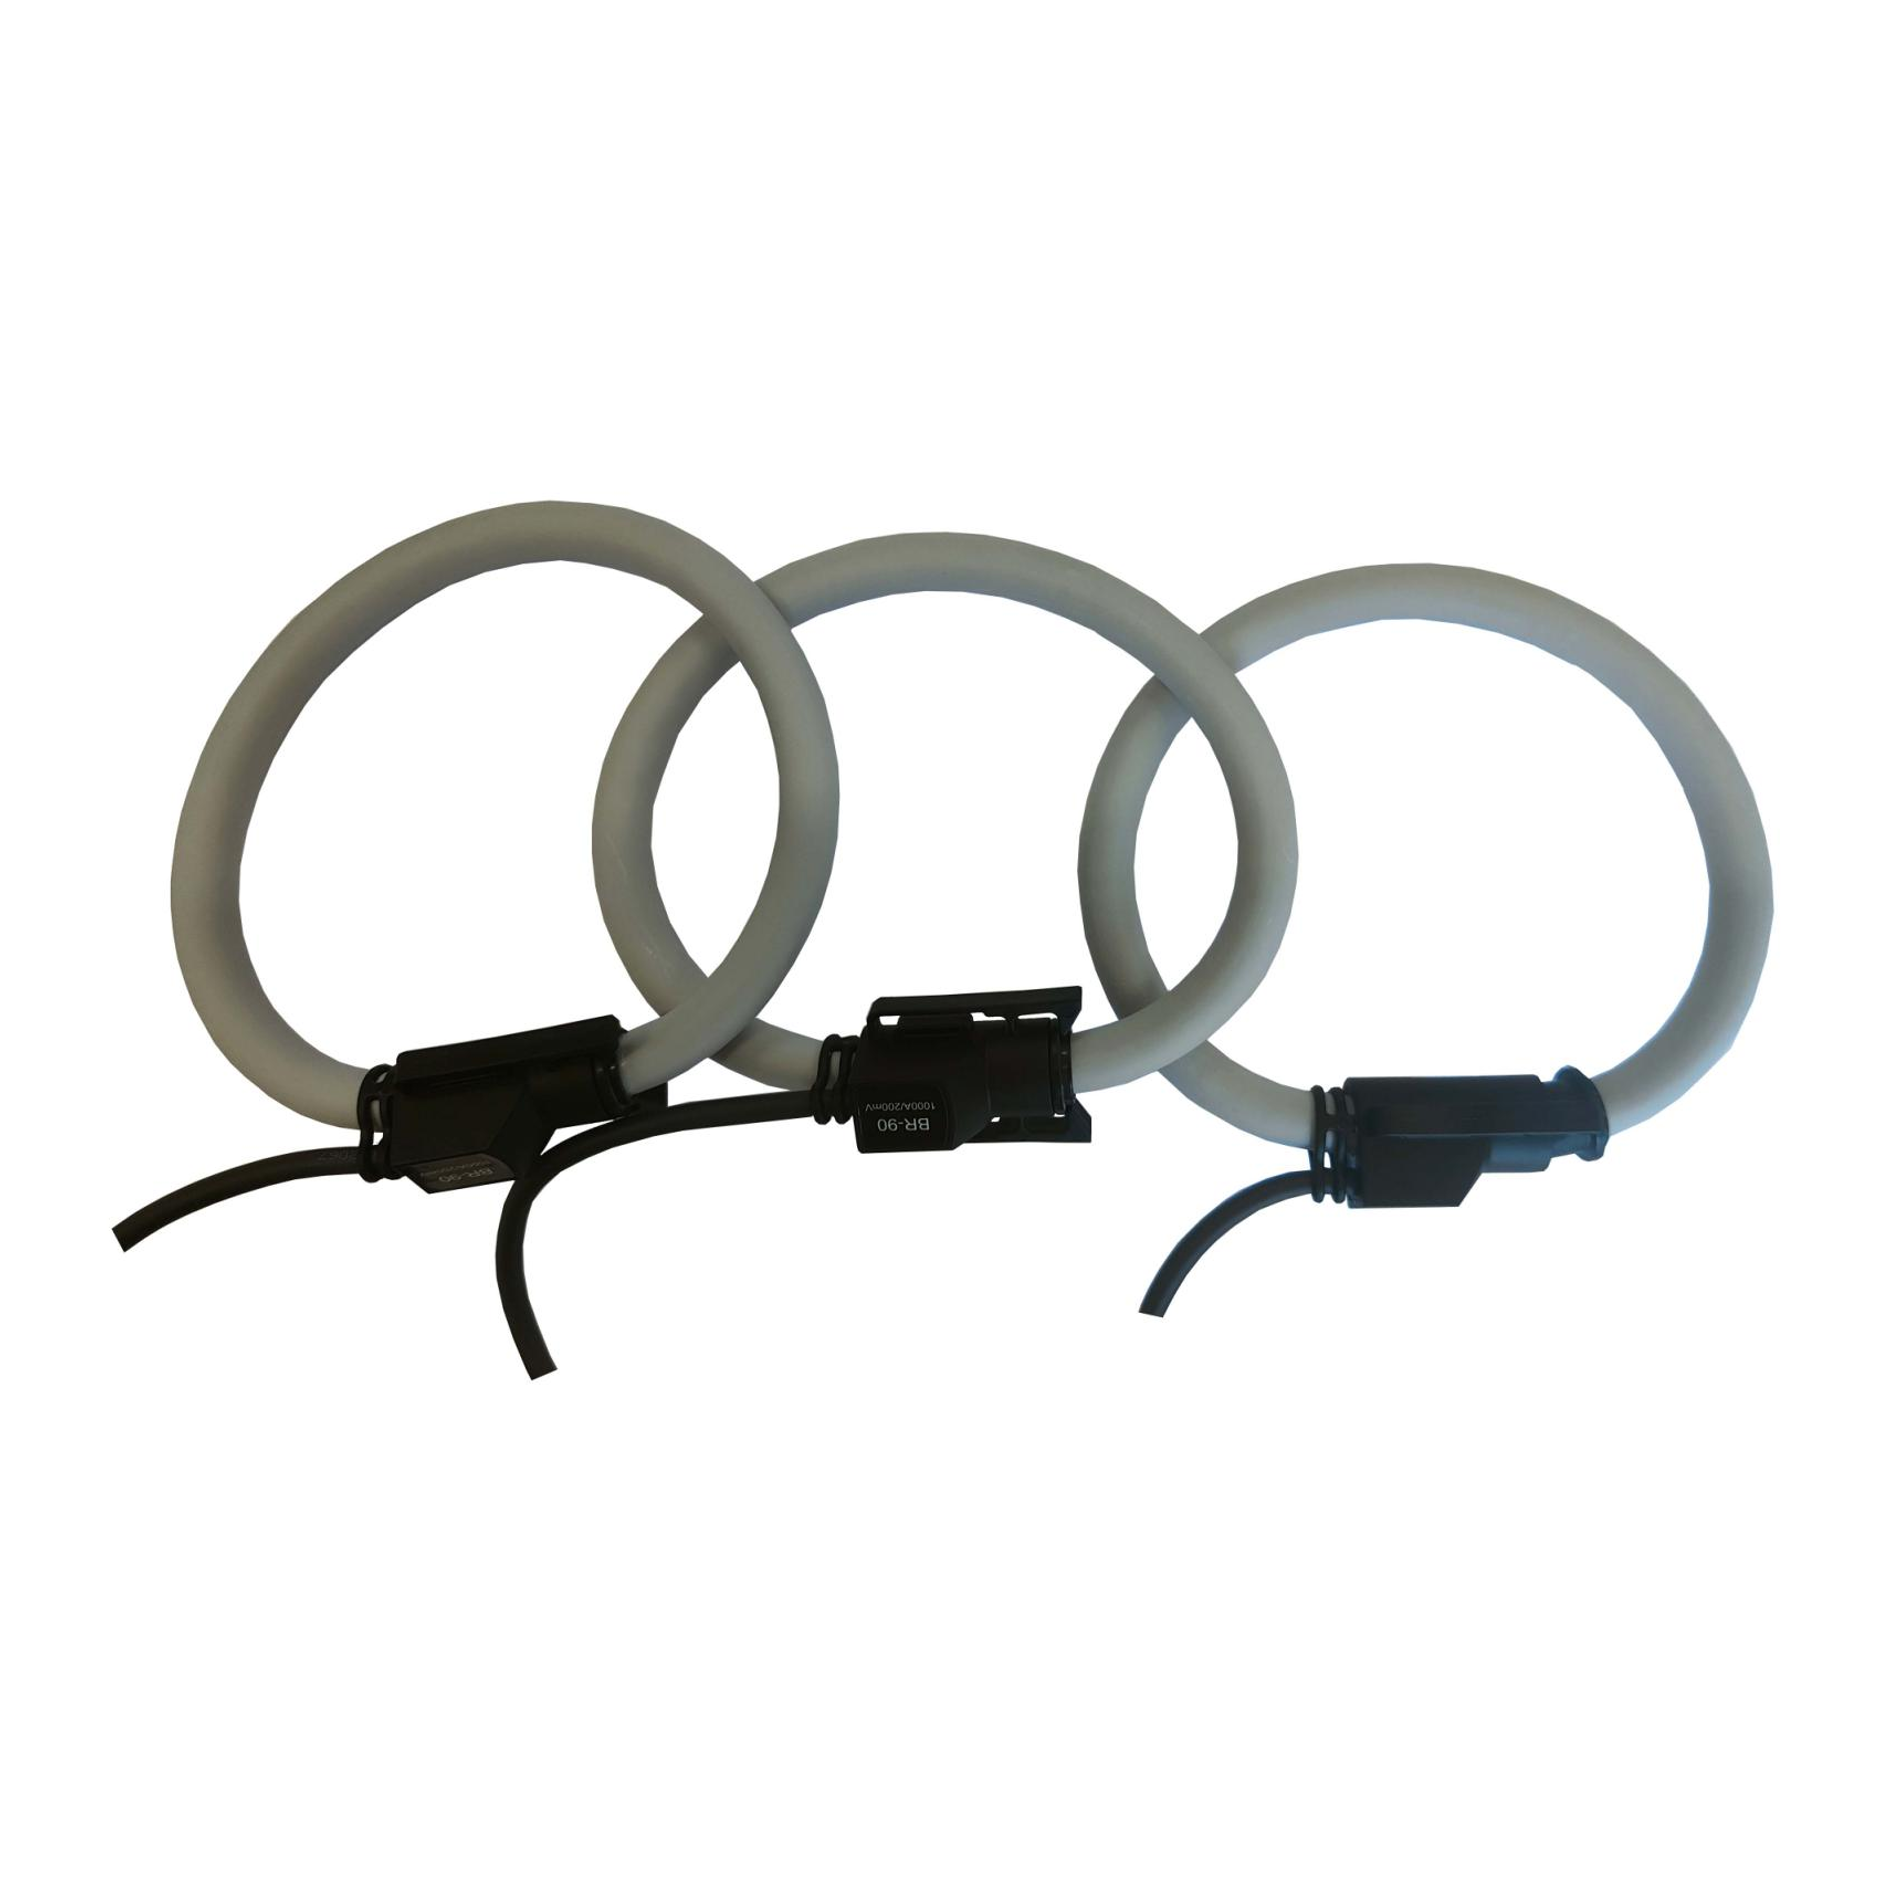 BR Series Rogowski Coil Flexible Current TransformerFlexible split-core AC sensor for wide-range current measurement, with no CT saturation and high bandwidth for power-quality, harmonic, and transient capture.View Product →
Whatever you select, verify three things before the survey starts: the specified bandwidth of the sensor, the actual burden of the measuring circuit, and the position of the conductor inside the measuring window. A conductor pushed against one side of the window is a common source of unexplained phase shift.
The steps below keep a harmonic survey comparable between visits, which matters more than any single reading.
Harmonic distortion is not a fixed property of a building. It changes with the production schedule, the output of the solar inverter, and how many EV chargers happen to be drawing at the same moment. That is why a one-week survey is usually followed by permanent monitoring on the two or three feeders that carried the highest distortion.
Permanent monitoring needs meters that publish harmonic data over Modbus RTU or TCP, a gateway that can forward it to a platform without losing timestamps, and threshold alarms set on the 95th percentile rather than on instantaneous peaks. Once the data is continuous, the useful comparison is no longer against a limit but against the same feeder last month, which is how you catch a filter degrading or a new drive being commissioned.
 Acrel AWT100 Smart Gateway Data Transfer UnitCE-certified wireless gateway with 4G, WiFi, Ethernet, LoRa, and RS485 downlink, connecting up to 25 devices for IoT energy-management data transmission.View Product →
Solutions of this kind are already used in IoT-based energy management systems, where harmonic trends sit next to consumption data and can be reviewed by the same team.
Partly. Many meters compute a THD value, but few apply the grouping, windowing and anti-aliasing required for a defensible result. Use them for trending and choose a dedicated Class A analyzer for compliance work.
At least seven days at 10-minute aggregation. Shorter logs usually miss the load condition that produces the highest distortion, and a single dominant harmonic often appears only during a specific process step.
THD is referenced to the fundamental component. TDD is referenced to the maximum demand load current, which is why current limits in IEEE 519 are expressed as TDD and scale with the short-circuit ratio at the coupling point.
Only if you are assessing interharmonics, ripple control or distortion above 2.5 kHz. The extended range to 9 kHz exists for those cases; for ordinary load harmonics the 25th to 50th order is the working range.
Yes. A reversed sensor or a mismatched ratio corrupts harmonic phase and power direction, and the error is invisible in a magnitude-only report. Five minutes with a resistive load saves a week of unusable data.
Harmonic distortion becomes manageable the moment you stop treating it as one number. Measure voltage distortion at the busbar, harmonic current per feeder, and the neutral separately, document the window and the sensor behind every figure, and the eventual fix, whether it is a detuned filter bank, a different drive setting or a transformer replacement, will be justified by data instead of by guesswork.
Class A analysisPer-feeder current sensingNeutral triplensContinuous trending
If you are specifying the hardware for a harmonic survey or building permanent monitoring into a new project, share your single-line diagram and load profile with our engineers. We will help you match the analyzer, sensors and gateway to the points you actually need to watch, so the first report you produce is one you can act on.


 Email: [email protected]
 Phone: +86-18702106858 / +86-21-69156352
No.253 Yulv Road, Jiading District, Shanghai, PRC 201801


