

 English
 Deutsch
News
Home / News / Industry News / How to Choose a Power Quality Analyzer: A Practical Buyer's Guide for Engineers
Consider a production line that stops twice a week. The utility says incoming voltage is within tolerance, and a handheld multimeter agrees. Yet the variable-frequency drives keep tripping on overvoltage. The cause, found only after connecting a power quality analyzer, is capacitor bank switching on the same feeder producing voltage transients above 120% of nominal.
That scenario explains the first rule of instrument selection: the analyzer determines what you will find. Choosing a power quality analyzer comes down to four questions. What problem are you investigating? What accuracy is needed to defend the data? Which parameters and logging features does the site require? How will the instrument be installed and supported? Answer these before comparing prices, and the rest of the specification becomes easier.
Write the objective in one sentence before opening any datasheet. Power quality investigations usually fall into one of three categories:
The category drives the form factor. Troubleshooting favors a portable analyzer that can be moved between feeders. Compliance and baseline tasks justify a fixed panel-mounted unit that logs continuously and reports to a central platform. Data center operators, for example, permanently install analyzers in power distribution units to capture every dip and interruption as part of their data center power monitoring programs. If the objective is still unclear, run a one-week survey with a simple logging meter; the results usually show which parameters deserve deeper investigation.
Accuracy class is the most consequential specification in a power quality analyzer. IEC 61000-4-30 defines measurement uncertainty and evaluation methods and assigns instruments to Class A or Class S.
The practical rule is short. If the data may be shown to a utility, an inspector, a client, or a court, choose Class A. A month of Class S recordings can be rejected because the measurement interval is not synchronized or the uncertainty exceeds the applicable limit. Class B from earlier standard editions is effectively obsolete and should not be a purchase criterion.
Class A status must be proven by a test report, not by a marketing claim. Genuine IEC 61000 Class A test reports document the uncertainty and test conditions for every declared parameter. Ask for one before ordering any analyzer.
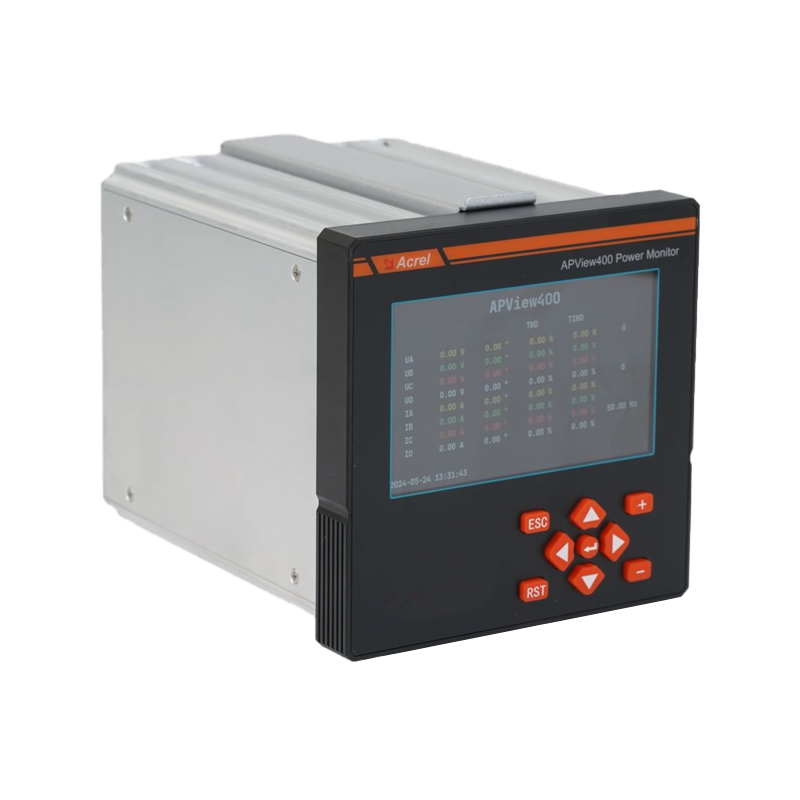
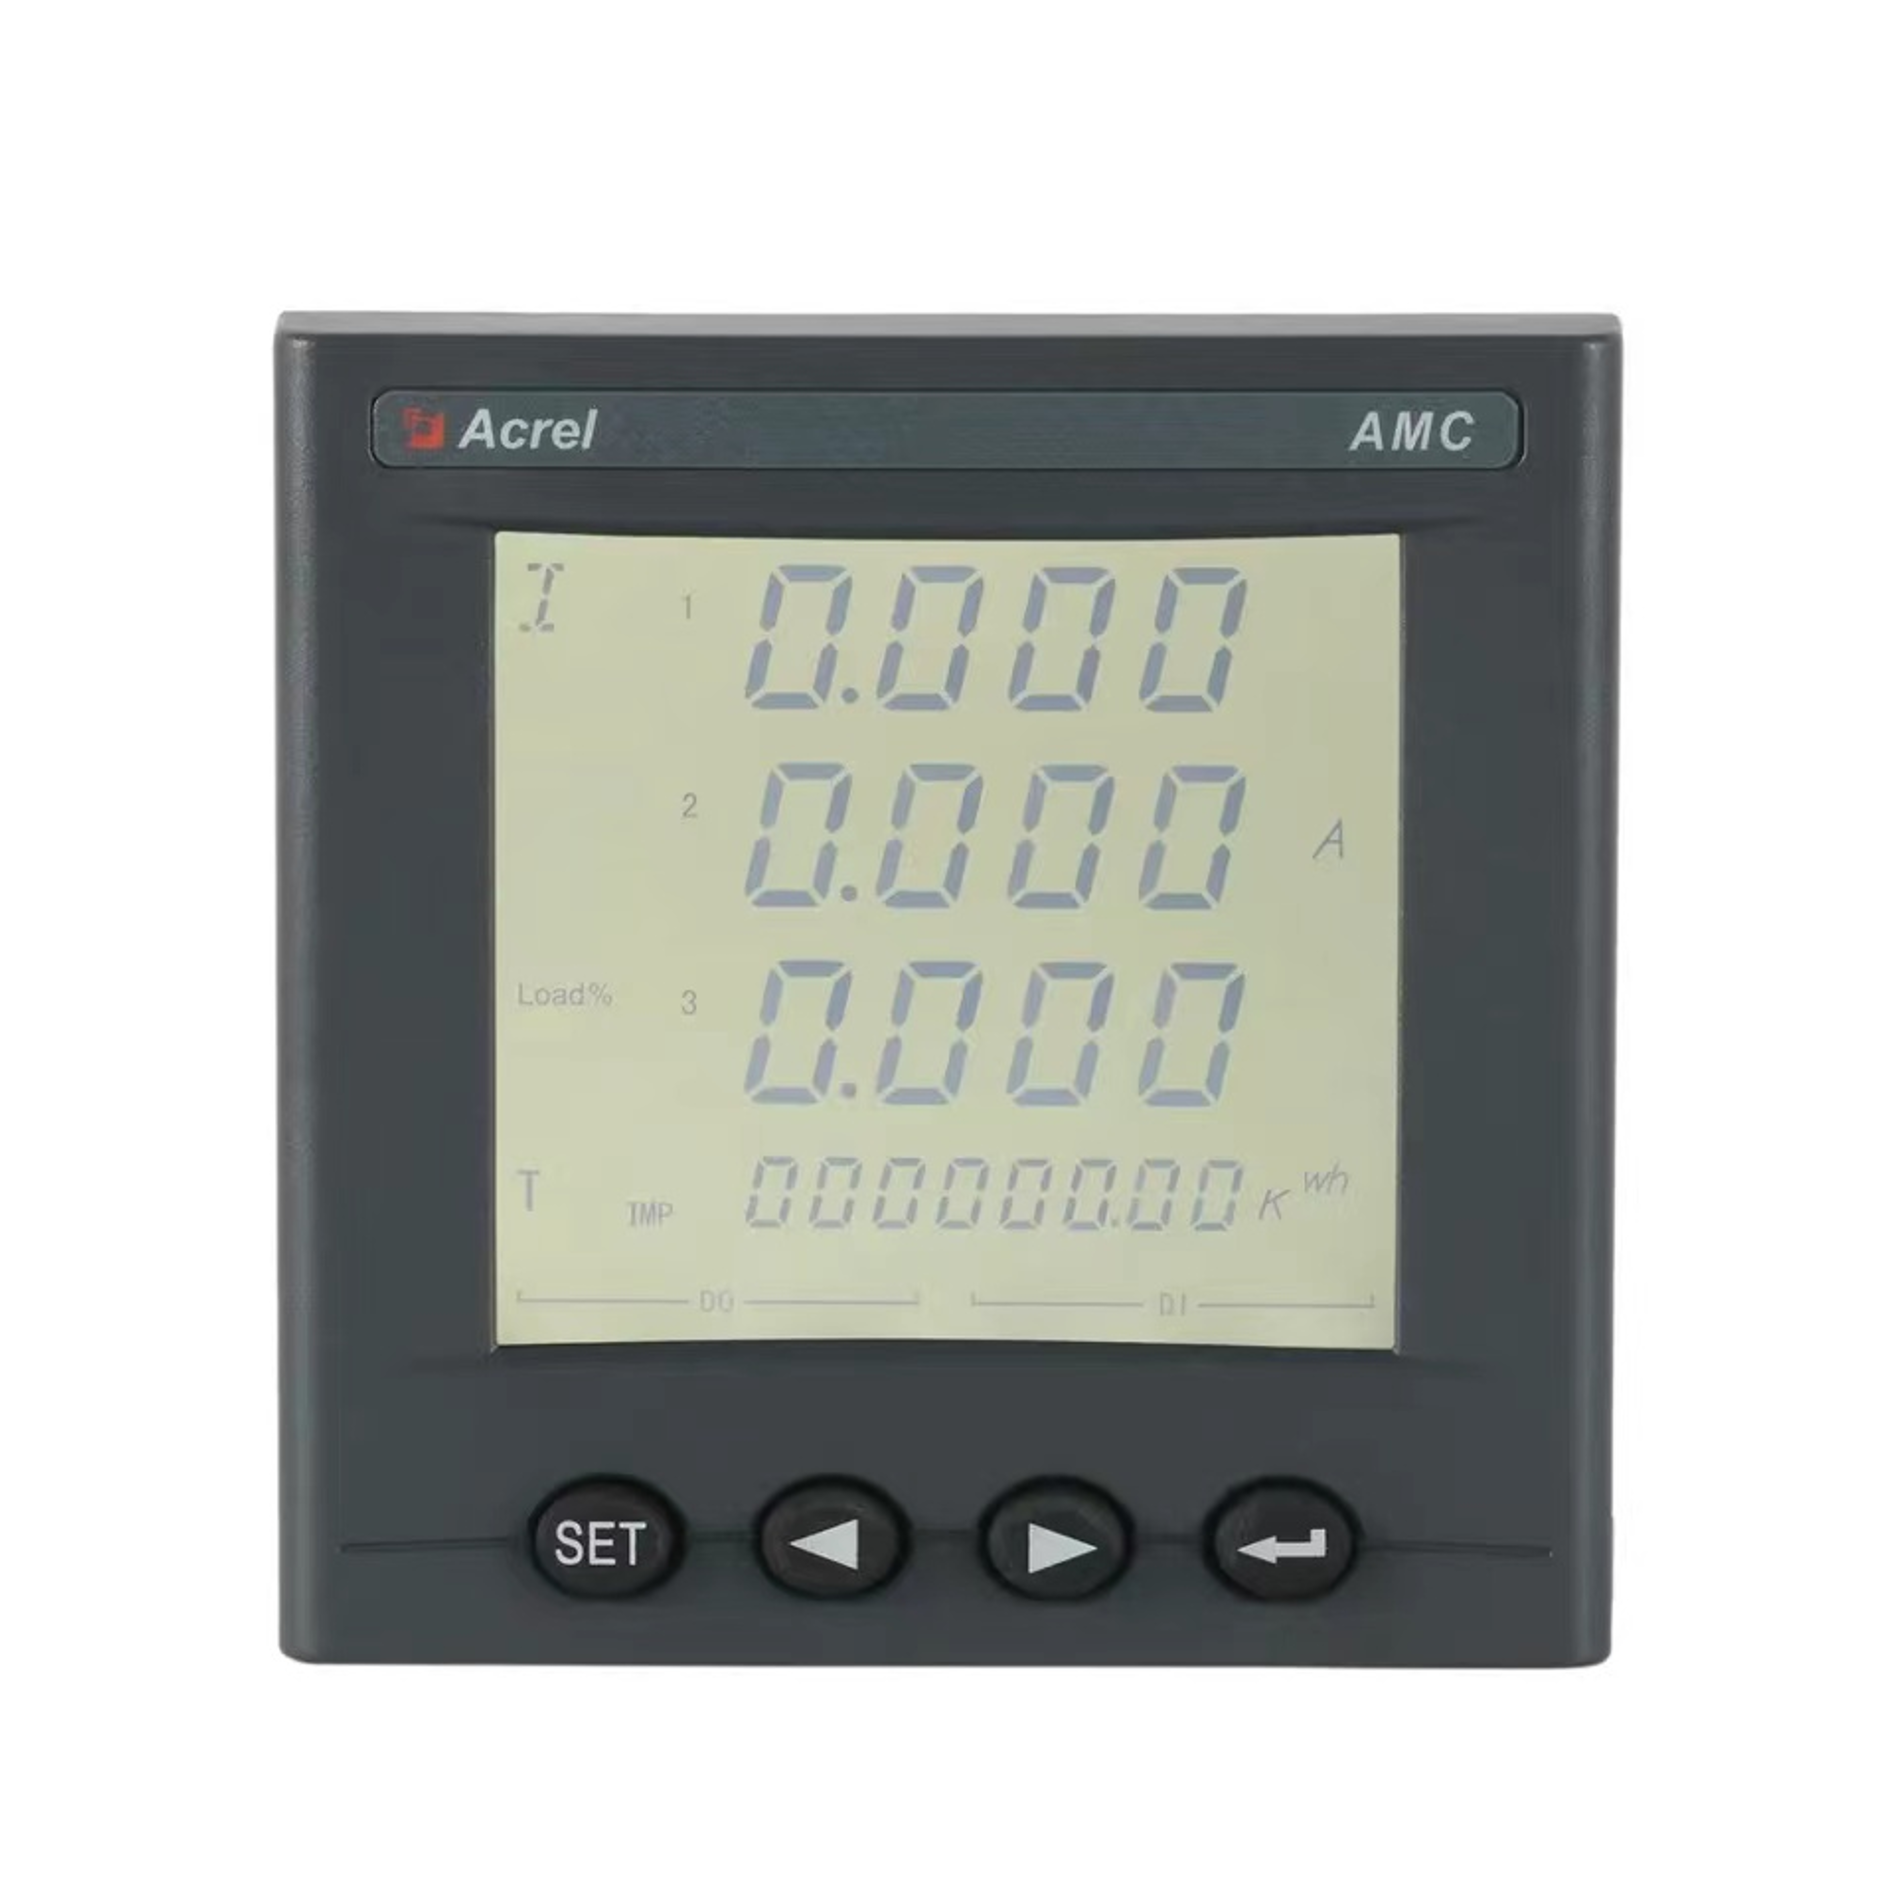
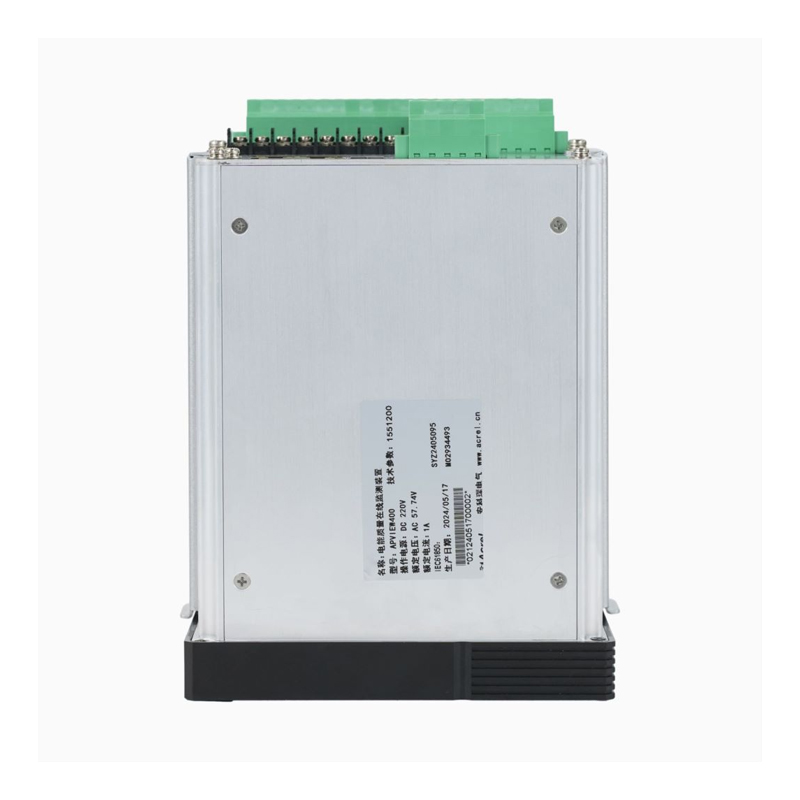 APView400 Class A Certified Power Quality Analyzer with Disturbance RecordingThis analyzer is relevant because the preceding paragraph stresses verifying genuine IEC 61000 Class A test reports. The APView400 carries an Ed.3 Class A certificate and offers disturbance waveform recording, direction detection, and high-accuracy measurement for supply systems up to 35kV.View Product →
No analyzer measures every parameter with equal depth, so match the feature list to the loads on your circuit. The table below summarizes the parameters that matter most in a selection decision.
| Parameter | What it tells you | Most relevant when |
|---|---|---|
| Voltage and current RMS | Supply level, loading, tolerance compliance | Checking supply quality, sizing conductors |
| Harmonics and THD | Waveform distortion from non-linear loads | VFDs, rectifiers, UPS, LED lighting |
| Power factor | Efficiency of energy use, reactive demand | PF correction, billing and demand charges |
| Unbalance | Uneven single-phase loads, faulty connections | Motor circuits, three-phase distribution |
| Dips, swells, interruptions | Utility events, large load switching | Continuous process lines, data centers |
| Transients and inrush | Lightning, capacitor switching, motor startup | Sensitive electronics, PLCs, drives |
| Flicker | Rapid voltage fluctuations | Arc furnaces, spot welding, large motors |
Confirm that the harmonic range covers at least the 50th order when the site has significant power electronics, and check that total harmonic distortion is computed for both voltage and current. Crest factor handling matters when current waveforms are heavily distorted; a low crest factor rating produces inaccurate RMS readings.
For intermittent faults, the storage concept matters more than the sensor. Event logging and waveform snapshot triggers let the analyzer record only what changed, such as a dip below 80% of nominal for more than one cycle, while trend data continues at a slower interval.
The most common field mistake is a wiring mismatch. Confirm that the analyzer's nominal voltage input covers your supply arrangement. A typical unit accepts 100-400 V line-to-neutral and up to 690 V line-to-line, but not every model supports both ranges. Also verify the measurement category, CAT III or CAT IV, against the installation point.
Current inputs deserve equal attention. Most analyzers accept 5 A or 1 A secondary signals from external current transformers, while direct-input models are limited to low full-scale currents. For retrofitting a live panel, split-core CTs clamp around the existing conductor without de-energizing the circuit, saving hours of downtime. For large busbars, awkward cable bundles, and temporary setups, flexible Rogowski coils are a practical alternative.
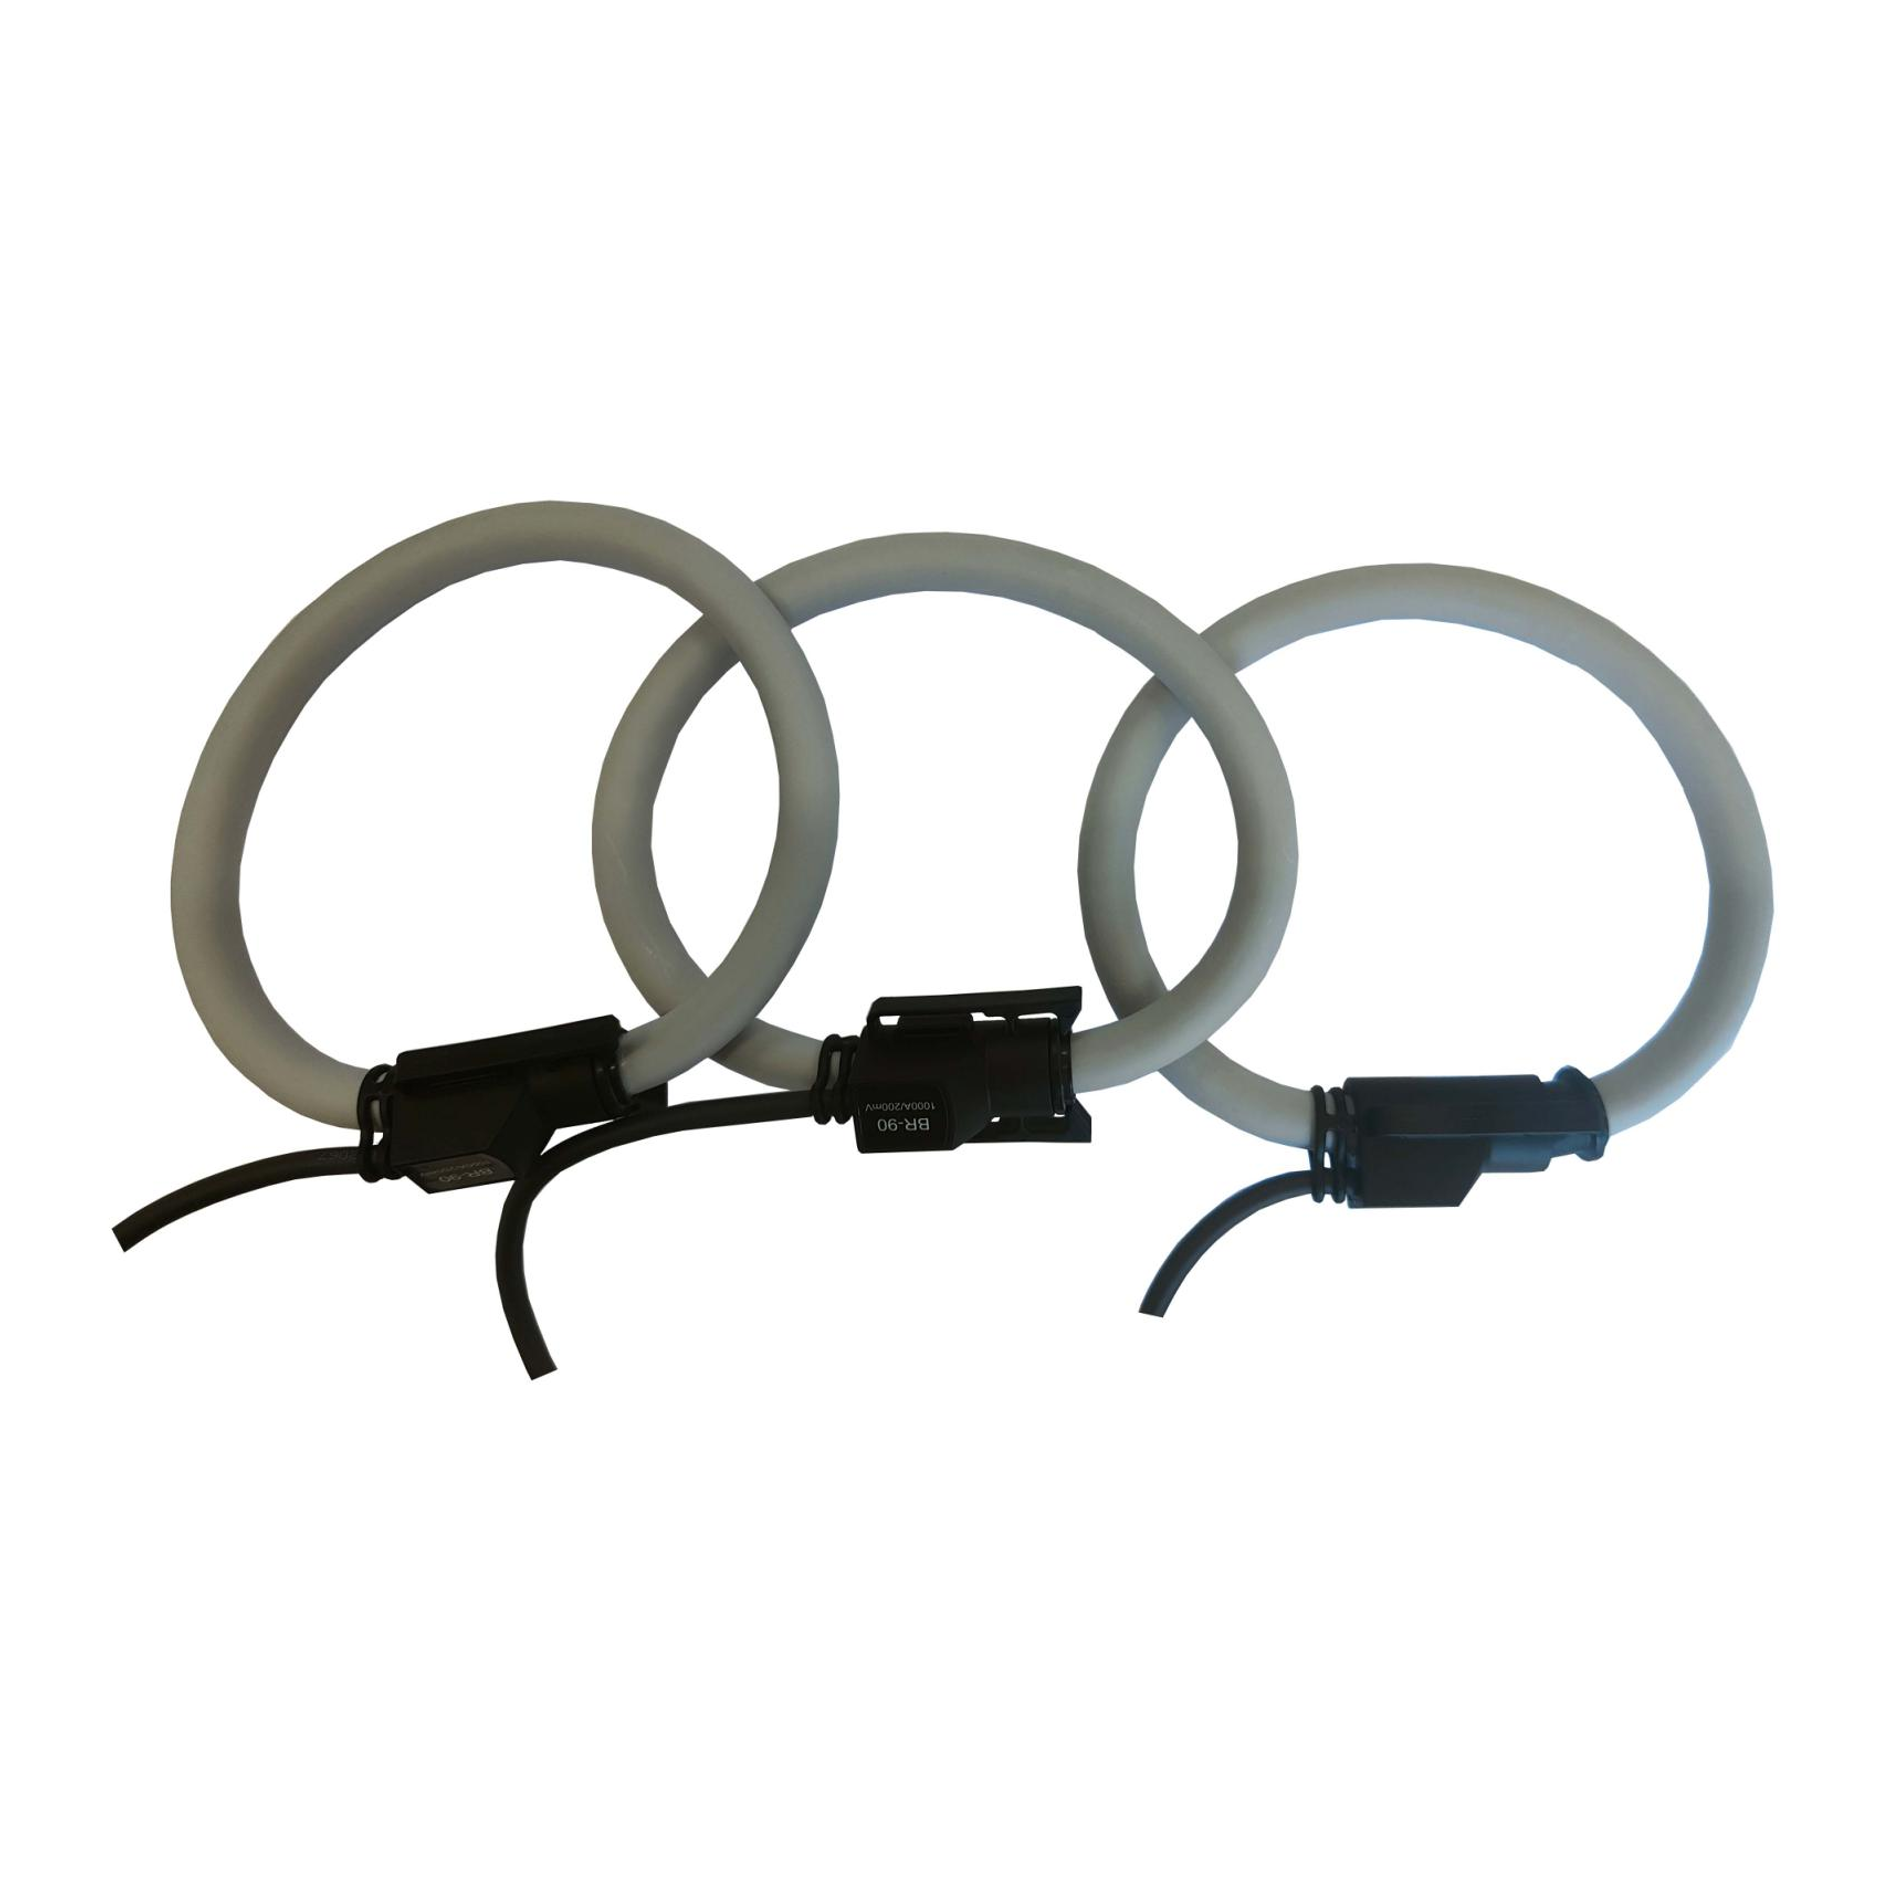 BR Series Flexible Rogowski Coil for High-Current MeasurementGiven the discussion about current inputs and CT options, this flexible coil is a practical choice for retrofits and large busbars. Supporting up to 500 kA with IP65 rating, it clamps around conductors without disconnection, eliminating open-circuit hazards and enabling accurate power-quality capture.View Product →
Check that the analyzer can handle the short-circuit levels of the feeder, and confirm that the operating temperature range matches the installation environment. A panel on a rooftop is much hotter than a climate-controlled switchroom.
Two analyzers with identical accuracy can produce completely different results when one logs properly and the other does not. Review four points before buying:
For a site with no staff at night, remote communication is a practical necessity. An analyzer that records a voltage dip at 02:30 but cannot notify anyone until the morning halves the value of that event record. Check whether alarm thresholds can trigger email or platform notifications.
Accuracy claims should always be backed by documentation. The reports most relevant to a power quality analyzer are:
A manufacturer that publishes these reports openly is likely to support the analyzer over its service life. If a candidate model has no published Class A test report, ask why.
The difference in purchase price between two analyzers is small compared with the cost of a failed investigation. Add up the full picture before deciding:
A permanently installed analyzer with Ethernet or 4G communication often justifies a slightly higher price by eliminating site visits and detecting faults earlier.
A multimeter displays the RMS voltage or current at one moment. A power quality analyzer measures many parameters simultaneously over long periods, records dips, swells, transients, and harmonic distortion, logs trends, and compares results with standards such as IEC 61000-4-30. For intermittent problems, only a logging analyzer can provide evidence.
One week is a reasonable starting point because it includes weekday load patterns, weekend shutdowns, and typical utility switching. Two to four weeks improves the chance of capturing rare events. Choose an analyzer that stores at least one week of trend data plus several hundred event records and waveform snapshots.
Choose Class A when the data may be used for compliance verification, contractual disputes, or equipment performance guarantees. Choose Class S for internal surveys and trend monitoring where absolute uncertainty is not critical. If the use case is uncertain, Class A is safer because Class S data cannot be re-analyzed at higher accuracy later.
Yes. Many analyzers are portable for troubleshooting and can be panel-mounted for permanent use. Check the operating temperature range, the enclosure option, and whether the communication interface matches your control network. A model with battery power, a graphical display, and Modbus plus Ethernet offers the most flexibility.
The choice of a power quality analyzer is a decision about an investigation, not just a test instrument. Define the problem, set the accuracy class, match the parameter set and logging capacity to the site, verify compliance through test reports, and compare total ownership cost. Working through these steps in order is faster than returning to a site a second time with a different analyzer.
The best analyzer is not the one with the longest feature list, but the one that is still logging on the day the event finally happens.


 Email: [email protected]
 Phone: +86-18702106858 / +86-21-69156352
No.253 Yulv Road, Jiading District, Shanghai, PRC 201801





