

 English
 Deutsch
News
Home / News / Industry News / How Industrial Energy Metering and Monitoring Systems Cut Facility Costs
Manufacturing plants, data centers, and large commercial campuses rarely fail at energy management because equipment is inefficient. They fail because nobody can see where the energy actually goes. A well-designed energy metering system replaces that blind spot with circuit-level visibility, turning a single utility bill into a map of consumption across production lines, HVAC zones, and support equipment.
This shift matters because energy costs at industrial sites are rarely flat. Compressors cycle unpredictably, motors draw inrush current on startup, and lighting or process loads shift with production schedules. Without granular metering, facility managers are left guessing which department or machine is driving cost spikes. An industrial energy meter deployed at the right points in the distribution network turns that guesswork into measurable data that can be audited, benchmarked, and acted on.
The transition from a single utility meter to a distributed monitoring network also changes how maintenance teams operate. Instead of reacting to a high monthly invoice weeks after the fact, teams working with an energy metering and monitoring systems deployment can compare consumption against production schedules in near real time, catching abnormal draw the same shift it occurs rather than the same quarter. That timing difference is often what separates a facility that steadily reduces cost from one that only reacts after a penalty charge appears.
Adoption tends to follow a predictable pattern across industries. Food processing plants often start with refrigeration and compressed air, since these systems run continuously and are sensitive to small efficiency losses. Automotive and metal fabrication sites usually prioritize welding and stamping lines, where demand spikes are sharp and short. Data centers and commercial campuses lean toward HVAC and lighting sub-metering because these loads are easiest to tie back to occupancy patterns. In every case, the starting point is chosen based on where uncertainty about energy use is currently highest, not where the equipment happens to be newest.
A facility with 40 to 60 sub-circuits typically recovers metering hardware costs within 8 to 14 months purely through identified waste, before any equipment upgrades are made.
Effective energy metering solutions are built from three complementary device types, each covering a different layer of the electrical distribution system. Understanding what each one measures helps avoid over-buying or under-monitoring a site.
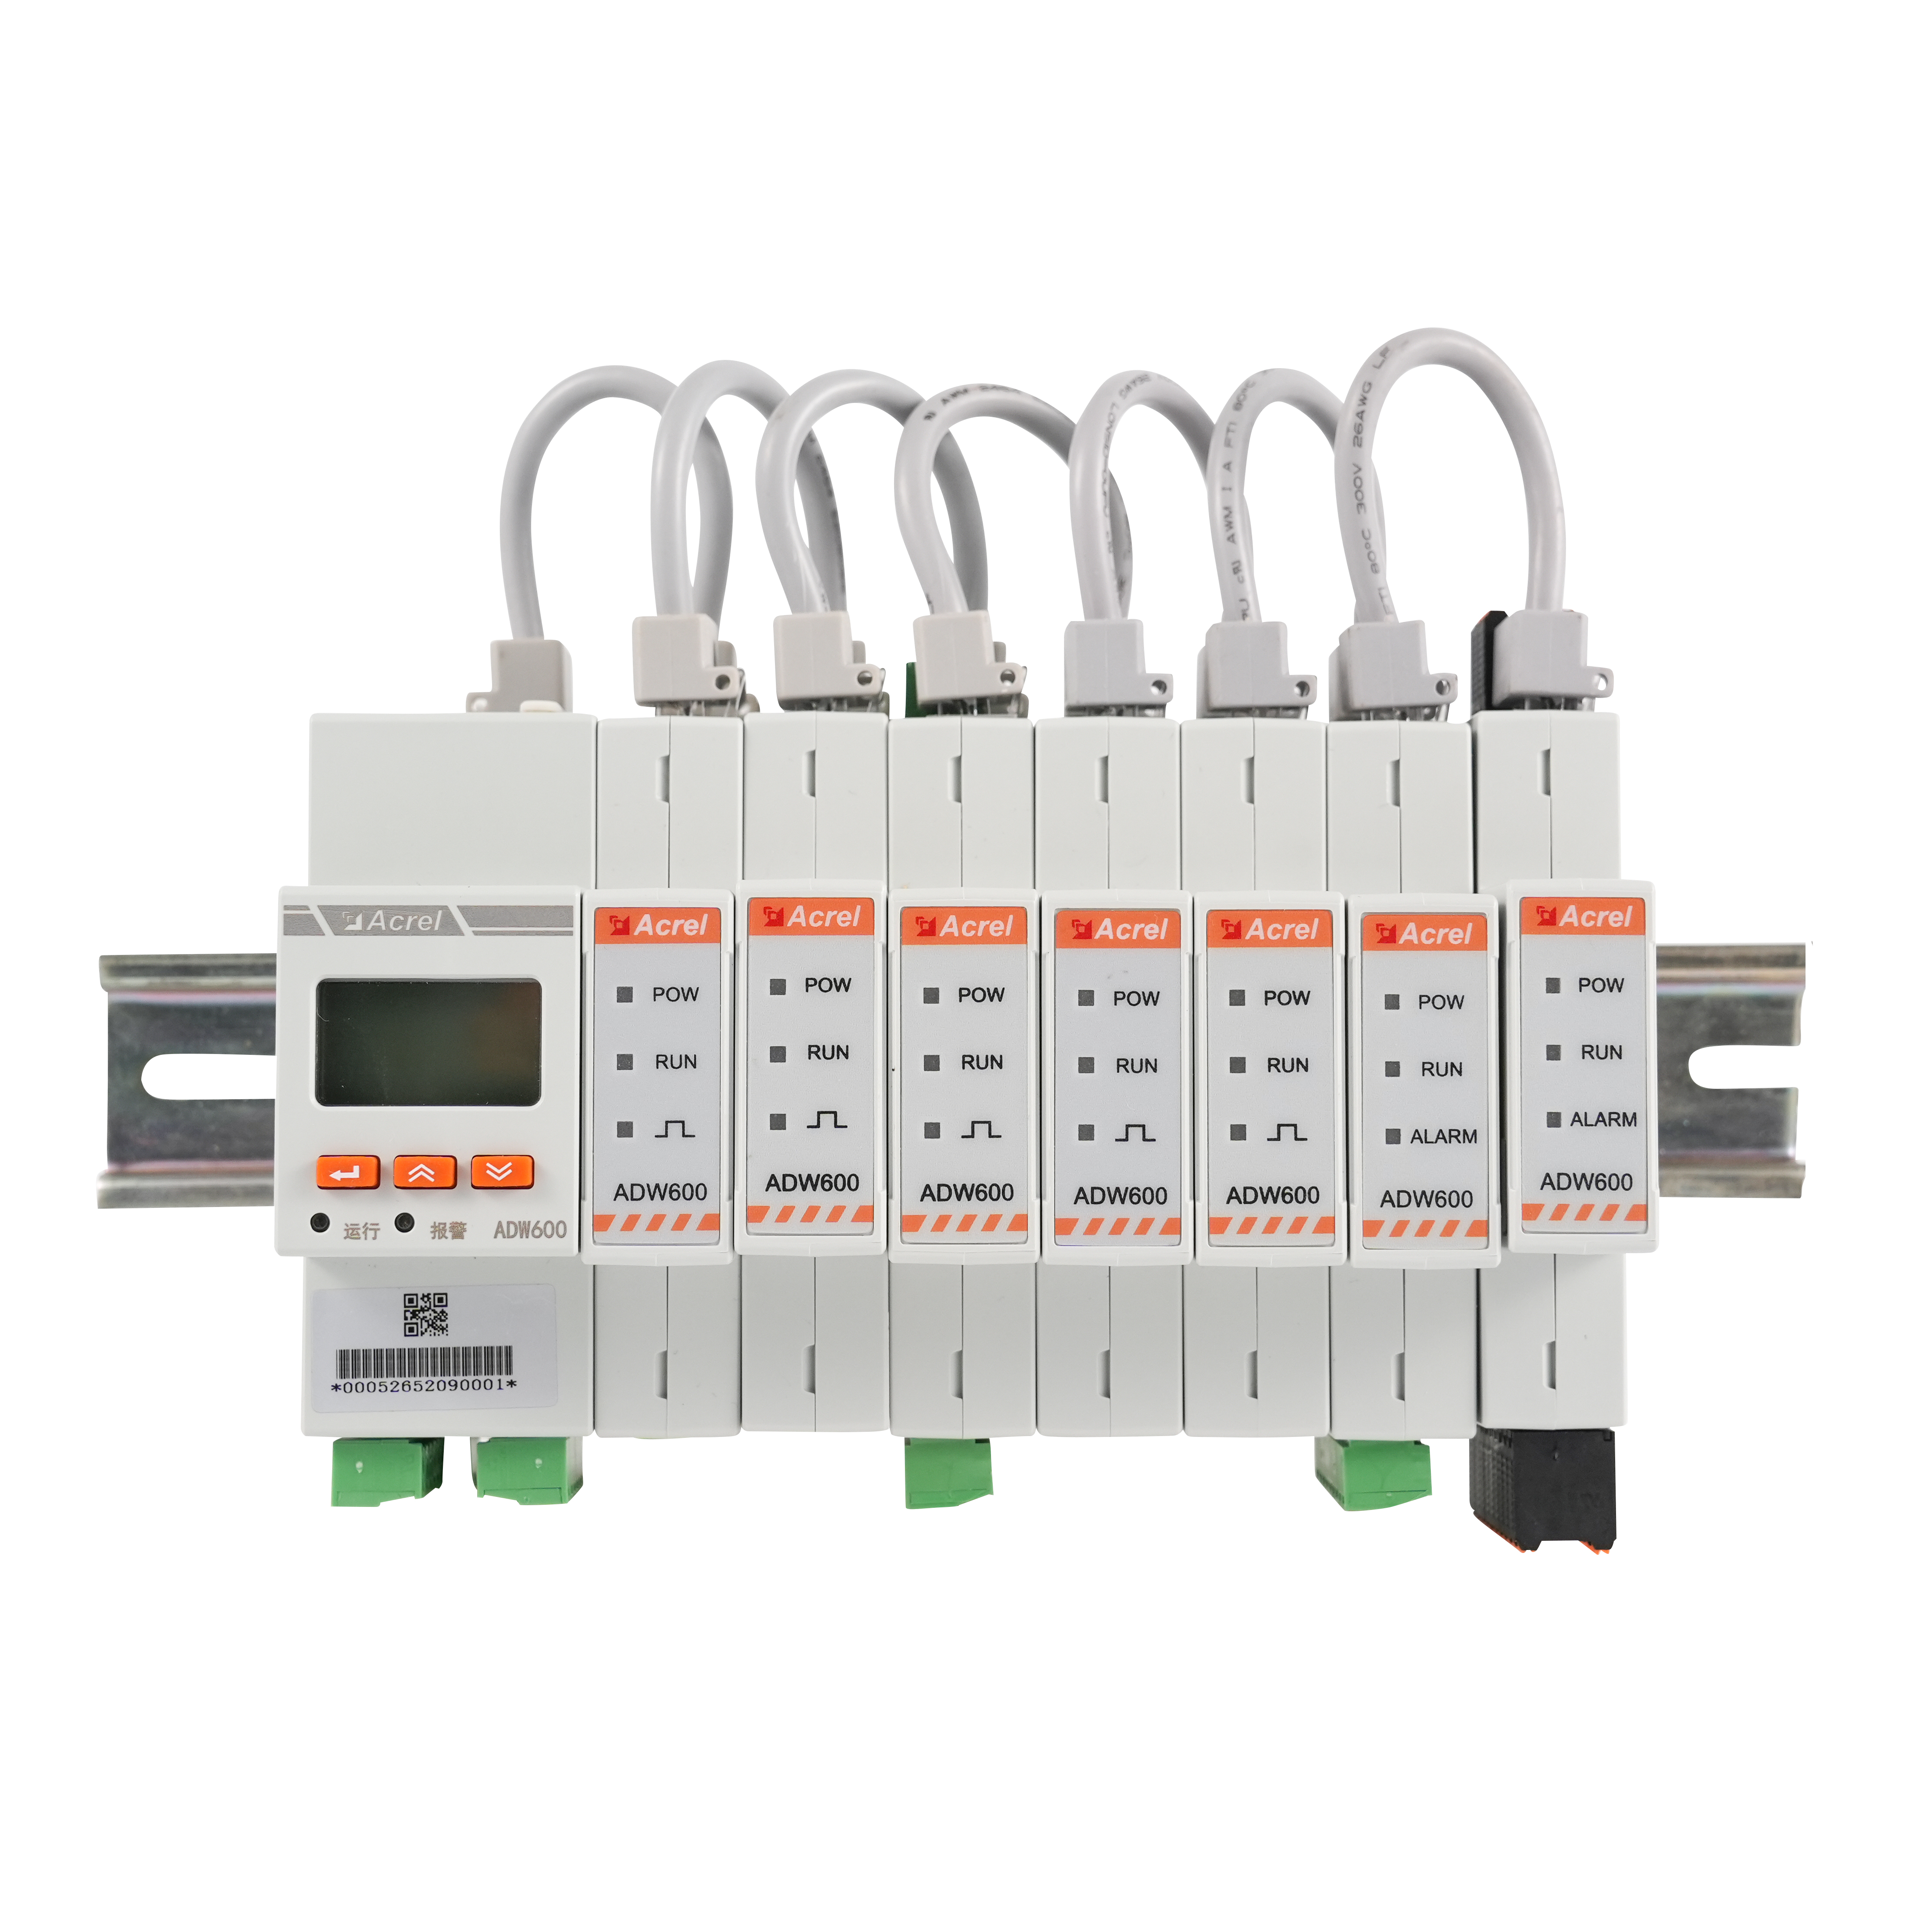
A multi-circuits energy meter consolidates dozens of feeder measurements into a single device, which is the practical answer when a distribution board feeds many small loads such as lighting panels, workstation groups, or branch circuits in a workshop. Instead of installing one meter per circuit, a single unit with multiple current inputs tracks each branch independently while sharing communication infrastructure, which lowers both hardware and wiring cost per monitored point.
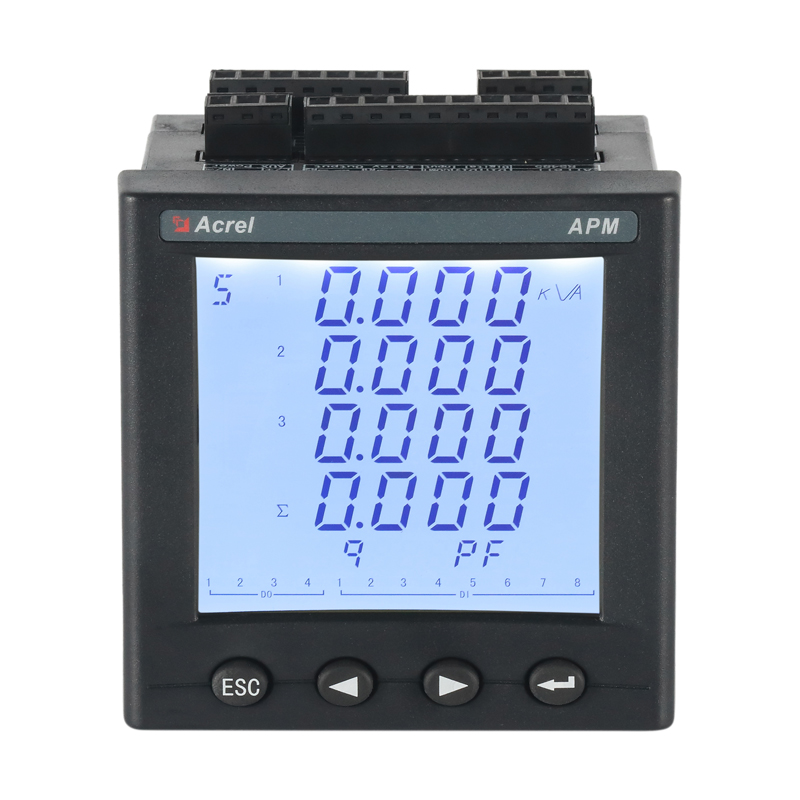
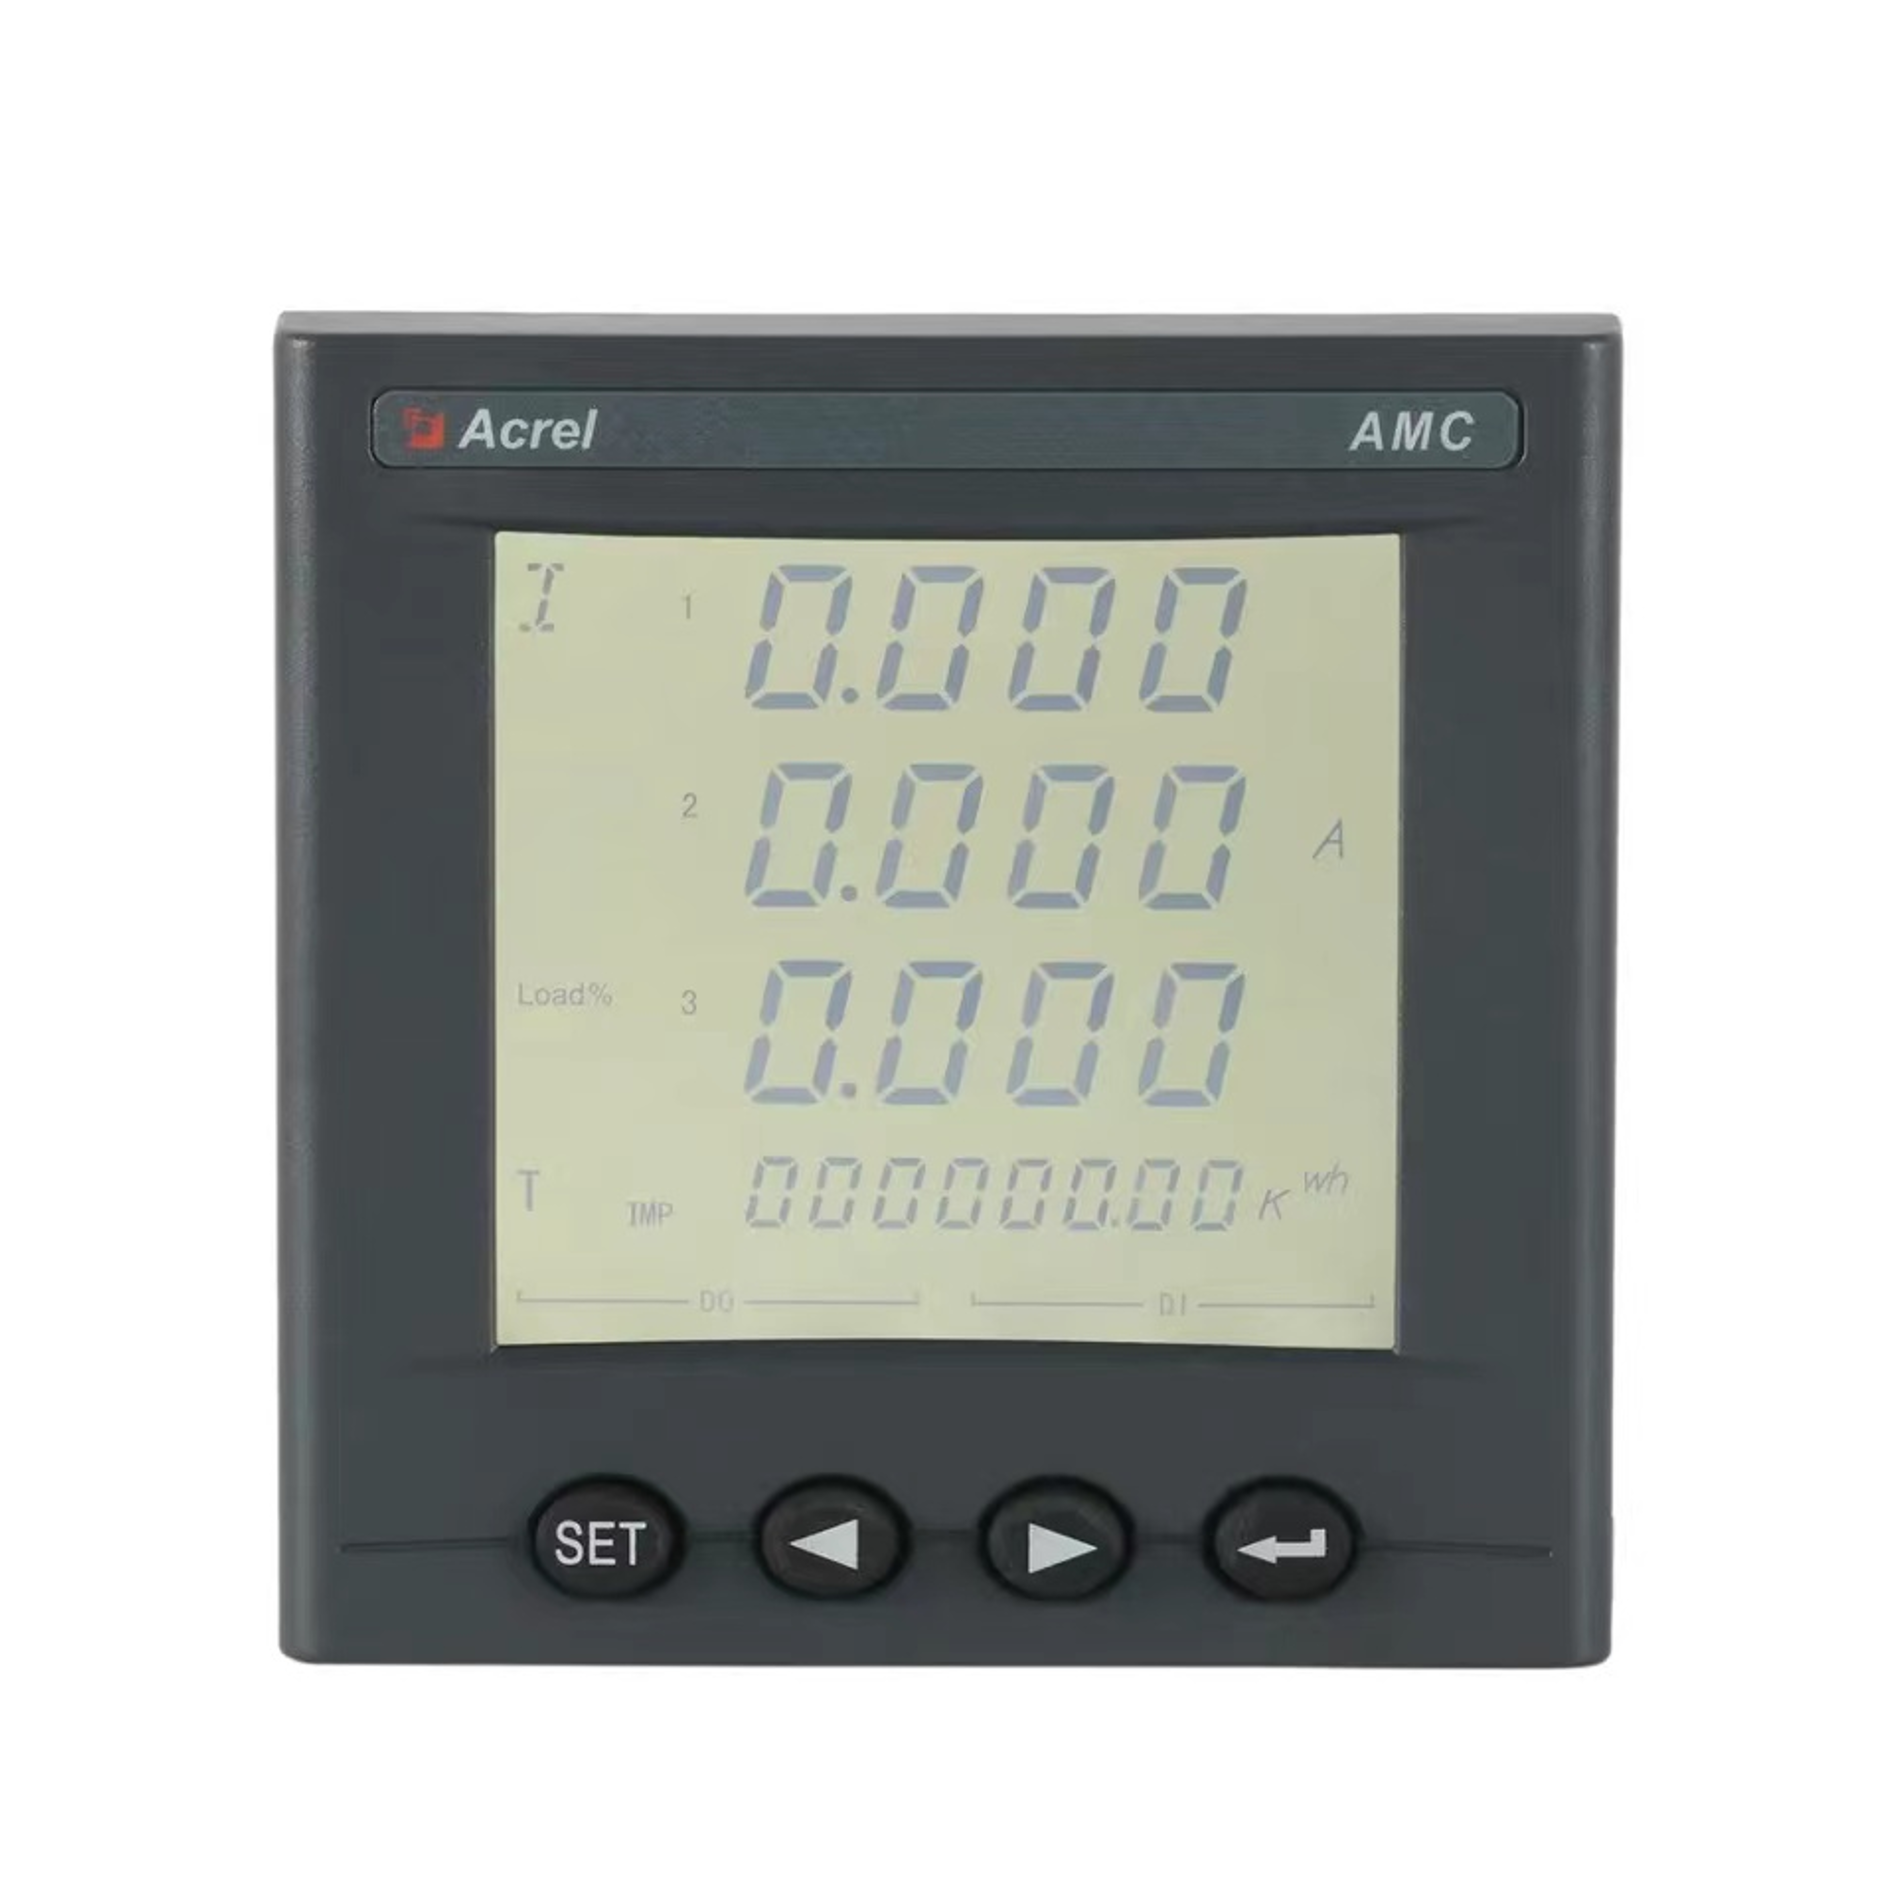
Where operators need an at-a-glance reading directly on a switchboard or motor control center, a panel mounted energy meter fits into the panel door and displays voltage, current, power, and energy totals without requiring a separate monitoring screen. These units are common on incoming feeders, generator panels, and major equipment breakers where a technician performing routine checks needs an immediate number rather than a software login.
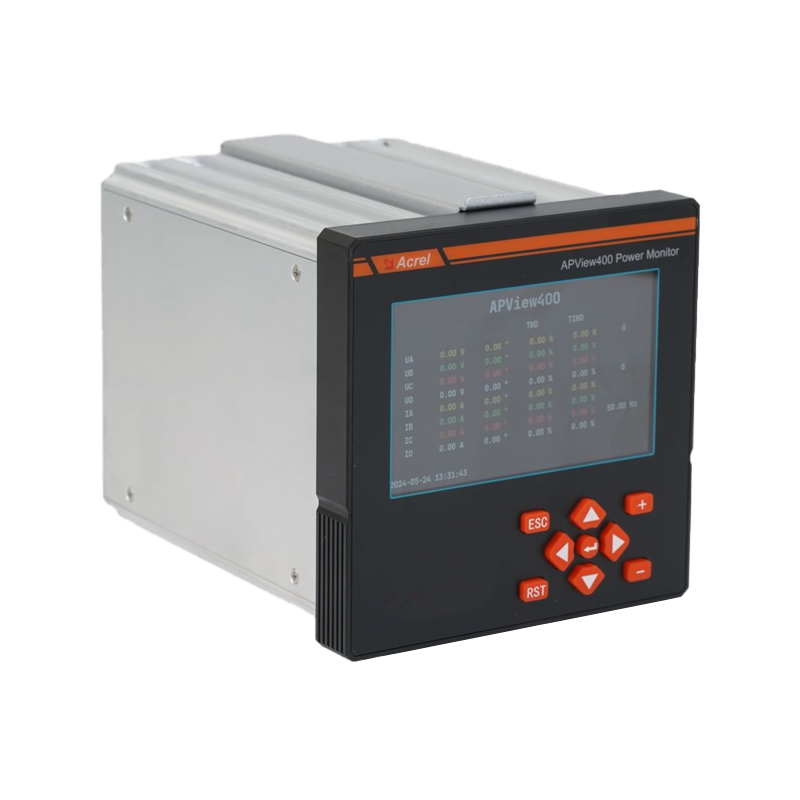
Energy consumption is only half the picture. A power quality analyzer captures harmonics, voltage sags, flicker, and transient events that standard meters ignore. On sites with variable frequency drives, welding equipment, or large motor starts, these disturbances degrade equipment life and trip sensitive electronics long before a utility bill reflects any problem.
| Device Type | Primary Measurement | Typical Install Point |
|---|---|---|
| Multi-circuits energy meter | Energy and demand across many branches | Sub-distribution panels, lighting boards |
| Panel mounted energy meter | Voltage, current, power at a single point | Main switchboards, generator panels |
| Power quality analyzer | Harmonics, sags, transients, flicker | Sensitive load feeders, VFD circuits |
These three device categories are not mutually exclusive, and most mature installations combine all three across different areas of the same building. A distribution room might rely on a multi-circuits energy meter to cover twenty branch circuits at once, while the incoming main feeder carries a panel mounted energy meter for operator readouts, and a handful of sensitive feeders near variable frequency drives carry a dedicated power quality analyzer. Layering the devices this way avoids paying for high-end disturbance detection on circuits that never see nonlinear loads, while still giving full visibility where it matters.
Selecting accuracy class is another practical decision that gets overlooked. Billing-grade sub-metering, particularly where costs are allocated back to tenants or departments, generally calls for a higher accuracy class than a meter used purely for trend monitoring. Mixing accuracy classes across a site is normal and often the more economical choice, as long as the billing-relevant points are held to a stricter standard.
Real-time power monitoring only delivers value if data travels reliably from the field device to a place where someone can act on it. The architecture below reflects the typical path used across industrial sites, regardless of building size.
Field devices sample electrical parameters continuously and send readings to a gateway that translates protocols such as Modbus into a format the monitoring software understands. From there, data lands on a local server or cloud platform where it is stored, compared against thresholds, and surfaced through dashboards that operations staff and facility engineers can review daily.
Protocol choice at the field layer shapes how easily a system scales later. Wired serial connections remain common on the factory floor because they hold up well against electrical noise near motors and drives, while Ethernet-based communication is increasingly used where distances are longer or where meters need to sit on the same network as other building automation equipment. Whichever transport layer is chosen, keeping a consistent protocol standard across a site significantly reduces integration time when new panels or buildings are added to the monitoring network later.
Latency expectations also vary by use case. Billing and reporting functions are generally satisfied with readings refreshed every few minutes, while demand response or fast overload protection benefits from sub-second sampling at the meter itself, even if that data is only summarized before it reaches the dashboard. Designing the polling interval around the actual decision being supported, rather than defaulting to the fastest possible rate everywhere, keeps network and storage loads manageable as the number of monitored points grows.
Sites that try to meter everything at once often stall on budget approval. A staged rollout tends to produce faster, more defensible results.
This order matters because sub-metering for facility efficiency works best when early data justifies the next investment stage, rather than committing capital across the whole site before any savings are proven.
A common mistake in the rollout process is treating sub-metering as a one-time installation rather than an evolving system. Production lines get reconfigured, equipment is replaced, and departments expand or contract, which means meter points that made sense during the first stage may no longer align with how the building is actually used two years later. Reviewing the metering map annually, alongside any major layout change, keeps the data structure relevant instead of gradually drifting away from the physical reality of the site.
It also helps to separate metering added for cost allocation from metering added purely for efficiency insight. Allocation-focused meters need to be defensible for internal billing and therefore benefit from higher accuracy and formal calibration records, while efficiency-focused meters can prioritize coverage and speed of deployment over precision, since their purpose is trend detection rather than dispute resolution.
A facility can show stable energy consumption on paper while still suffering from disturbances that shorten equipment life. This is the gap that power quality analysis for factories is designed to close.
| Disturbance | Common Cause | Typical Impact |
|---|---|---|
| Voltage sag | Large motor starts, switching events | Nuisance trips on sensitive drives |
| Harmonic distortion | Variable frequency drives, rectifiers | Overheating in transformers and cables |
| Flicker | Arc furnaces, welding equipment | Lighting instability, operator complaints |
| Transients | Capacitor switching, lightning | Damage to control electronics |
Continuous monitoring makes these patterns visible over time instead of only during a complaint-driven site visit, which lets maintenance teams correlate disturbances with specific equipment cycles rather than treating each incident as isolated.
The financial case for power quality analysis is easiest to make once a facility can point to repeat failures on the same equipment class. Premature bearing wear on motors, nuisance tripping on protective relays, and shortened capacitor life are frequently traced back to harmonic distortion or repeated voltage sags rather than a defect in the equipment itself. Once a power quality analyzer confirms the pattern, corrective measures such as filtering, load rebalancing, or adjusted starting sequences can be targeted at the actual cause instead of cycling through replacement parts.
Regulatory and contractual pressure adds a second reason to monitor power quality proactively. Many utilities apply penalty clauses for poor power factor or excessive harmonic injection back onto the grid, and sites with on-site generation or renewable integration face additional interconnection requirements tied to voltage and frequency stability. Continuous analyzer data gives facility teams the evidence needed to demonstrate compliance rather than relying on a single annual test that may not reflect actual operating conditions.
Specification decisions should follow the layout of the electrical system rather than a generic checklist. The comparison below outlines how site characteristics typically map to device choice.
| Site Characteristic | Recommended Approach |
|---|---|
| Many small branch circuits on one panel | Multi-circuits energy meter with shared communication |
| Operators need on-panel readouts | Panel mounted energy meter at key feeders |
| VFDs, welders, or nonlinear loads present | Power quality analyzer on affected circuits |
| Mixed departments with shared billing needs | Multifunction energy meter with sub-billing reports |
Communication protocol compatibility with existing building management or SCADA systems deserves equal weight to accuracy class when narrowing down options, since a highly accurate meter that cannot integrate with existing software still leaves data trapped at the panel.
Physical installation constraints also influence the final configuration. Panel space, available current transformer ratios, and existing conduit routing often determine whether a multi-circuits solution or a series of individual meters is more practical on a given board. Retrofits into older switchgear tend to favor compact multi-circuit devices that minimize new wiring, while new-build panels have more flexibility to distribute individual meters across each major feeder from the start.
Meters generate raw numbers; industrial energy management software turns those numbers into decisions. The functional layers below are common across mature platforms.
Without this software layer, even a dense meter network produces spreadsheets nobody has time to review. The software is what keeps monitoring data connected to operational action.
Integration with existing enterprise systems is often the deciding factor in software selection. Facilities running computerized maintenance management systems or production scheduling platforms get more value from energy software that can exchange data with those tools, since it allows energy anomalies to be cross-referenced against maintenance events or output schedules automatically rather than through manual comparison after the fact.
Most underperforming installations do not fail because of faulty hardware. They fail because of avoidable planning gaps that surface only after the system is already live.
Avoiding these issues generally costs nothing beyond planning time, yet it determines whether a facility actually uses its monitoring data six months after installation or lets the dashboards go unopened.
| Step | Action |
|---|---|
| 1 | Map the single-line diagram and identify major feeders |
| 2 | Select meter types per panel based on circuit count and criticality |
| 3 | Confirm communication protocol matches existing infrastructure |
| 4 | Set alarm thresholds using at least one full production cycle of baseline data |
| 5 | Schedule quarterly review of trend reports with facility stakeholders |
A multi-circuits energy meter is built to monitor many branch circuits from one device, while the term multifunction energy meter usually describes a single-circuit meter that reports several parameters such as voltage, current, power factor, and harmonics from one measurement point.
Metering the main incomer plus the three or four largest equipment groups is usually enough to identify the biggest savings opportunities before expanding to full sub-metering coverage.
It can provide local readings for quick checks, but without software the data is not stored or trended, which limits its usefulness for identifying gradual efficiency losses.
Power quality issues such as harmonics or sags often damage equipment and shorten service life without necessarily increasing total energy consumption, so a normal bill does not rule out disturbance-related risk.
Monthly review is typical for stable sites, while facilities with frequent VFD use, welding, or motor starts benefit from continuous monitoring with automated alarm thresholds rather than periodic checks.
No, most facilities see clear savings after metering just the main incomer and the largest two or three equipment groups, which is usually enough to identify the leading causes of unexplained cost before a full sub-metering rollout is justified.


 Email: [email protected]
 Phone: +86-18702106858 / +86-21-69156352
No.253 Yulv Road, Jiading District, Shanghai, PRC 201801





