

 English
 Deutsch
News
Home / News / Industry News / How Precision Energy Metering Turns Guesswork Into Measurable Solar Power Gains
A rooftop solar array can look perfectly healthy on its inverter screen while still losing five to twelve percent of its potential yield to shading, connector degradation, or string mismatch. The inverter's built-in display is designed to show trends, not certified numbers. It typically carries a wide accuracy tolerance, which is fine for a quick glance but risky when that same number is used to verify a warranty claim, calculate a net metering credit, or diagnose a underperforming string.
The gap between what an inverter reports and what actually flows through the wiring is where a dedicated energy meter for solar inverter / ES systems becomes valuable. These meters are built to metrology-grade accuracy classes, independent of the inverter's internal firmware, and they measure the same electrical event from a different, more precise vantage point.
| Measurement Source | Typical Accuracy Class | Best Use Case |
|---|---|---|
| Inverter Display Estimate | Class 2.0 or wider | Quick daily trend check |
| Standalone Utility-Grade Meter | Class 0.5S or 1.0 | Billing, warranty, and audit records |
| Wireless Submetering Node | Class 0.5 to 1.0 | Circuit-level fault isolation |
The difference is not academic. On a mid-size residential system producing roughly 30 kilowatt-hours a day, a two percent measurement drift compounds into hundreds of kilowatt-hours of unexplained variance over a year, enough to obscure a genuinely failing panel string behind normal weather noise.
A basic kilowatt-hour counter answers only one question: how much energy passed through the wire. A properly specified wireless iot energy meter answers several more, and those extra data points are what turn a passive dashboard into an active diagnostic tool.
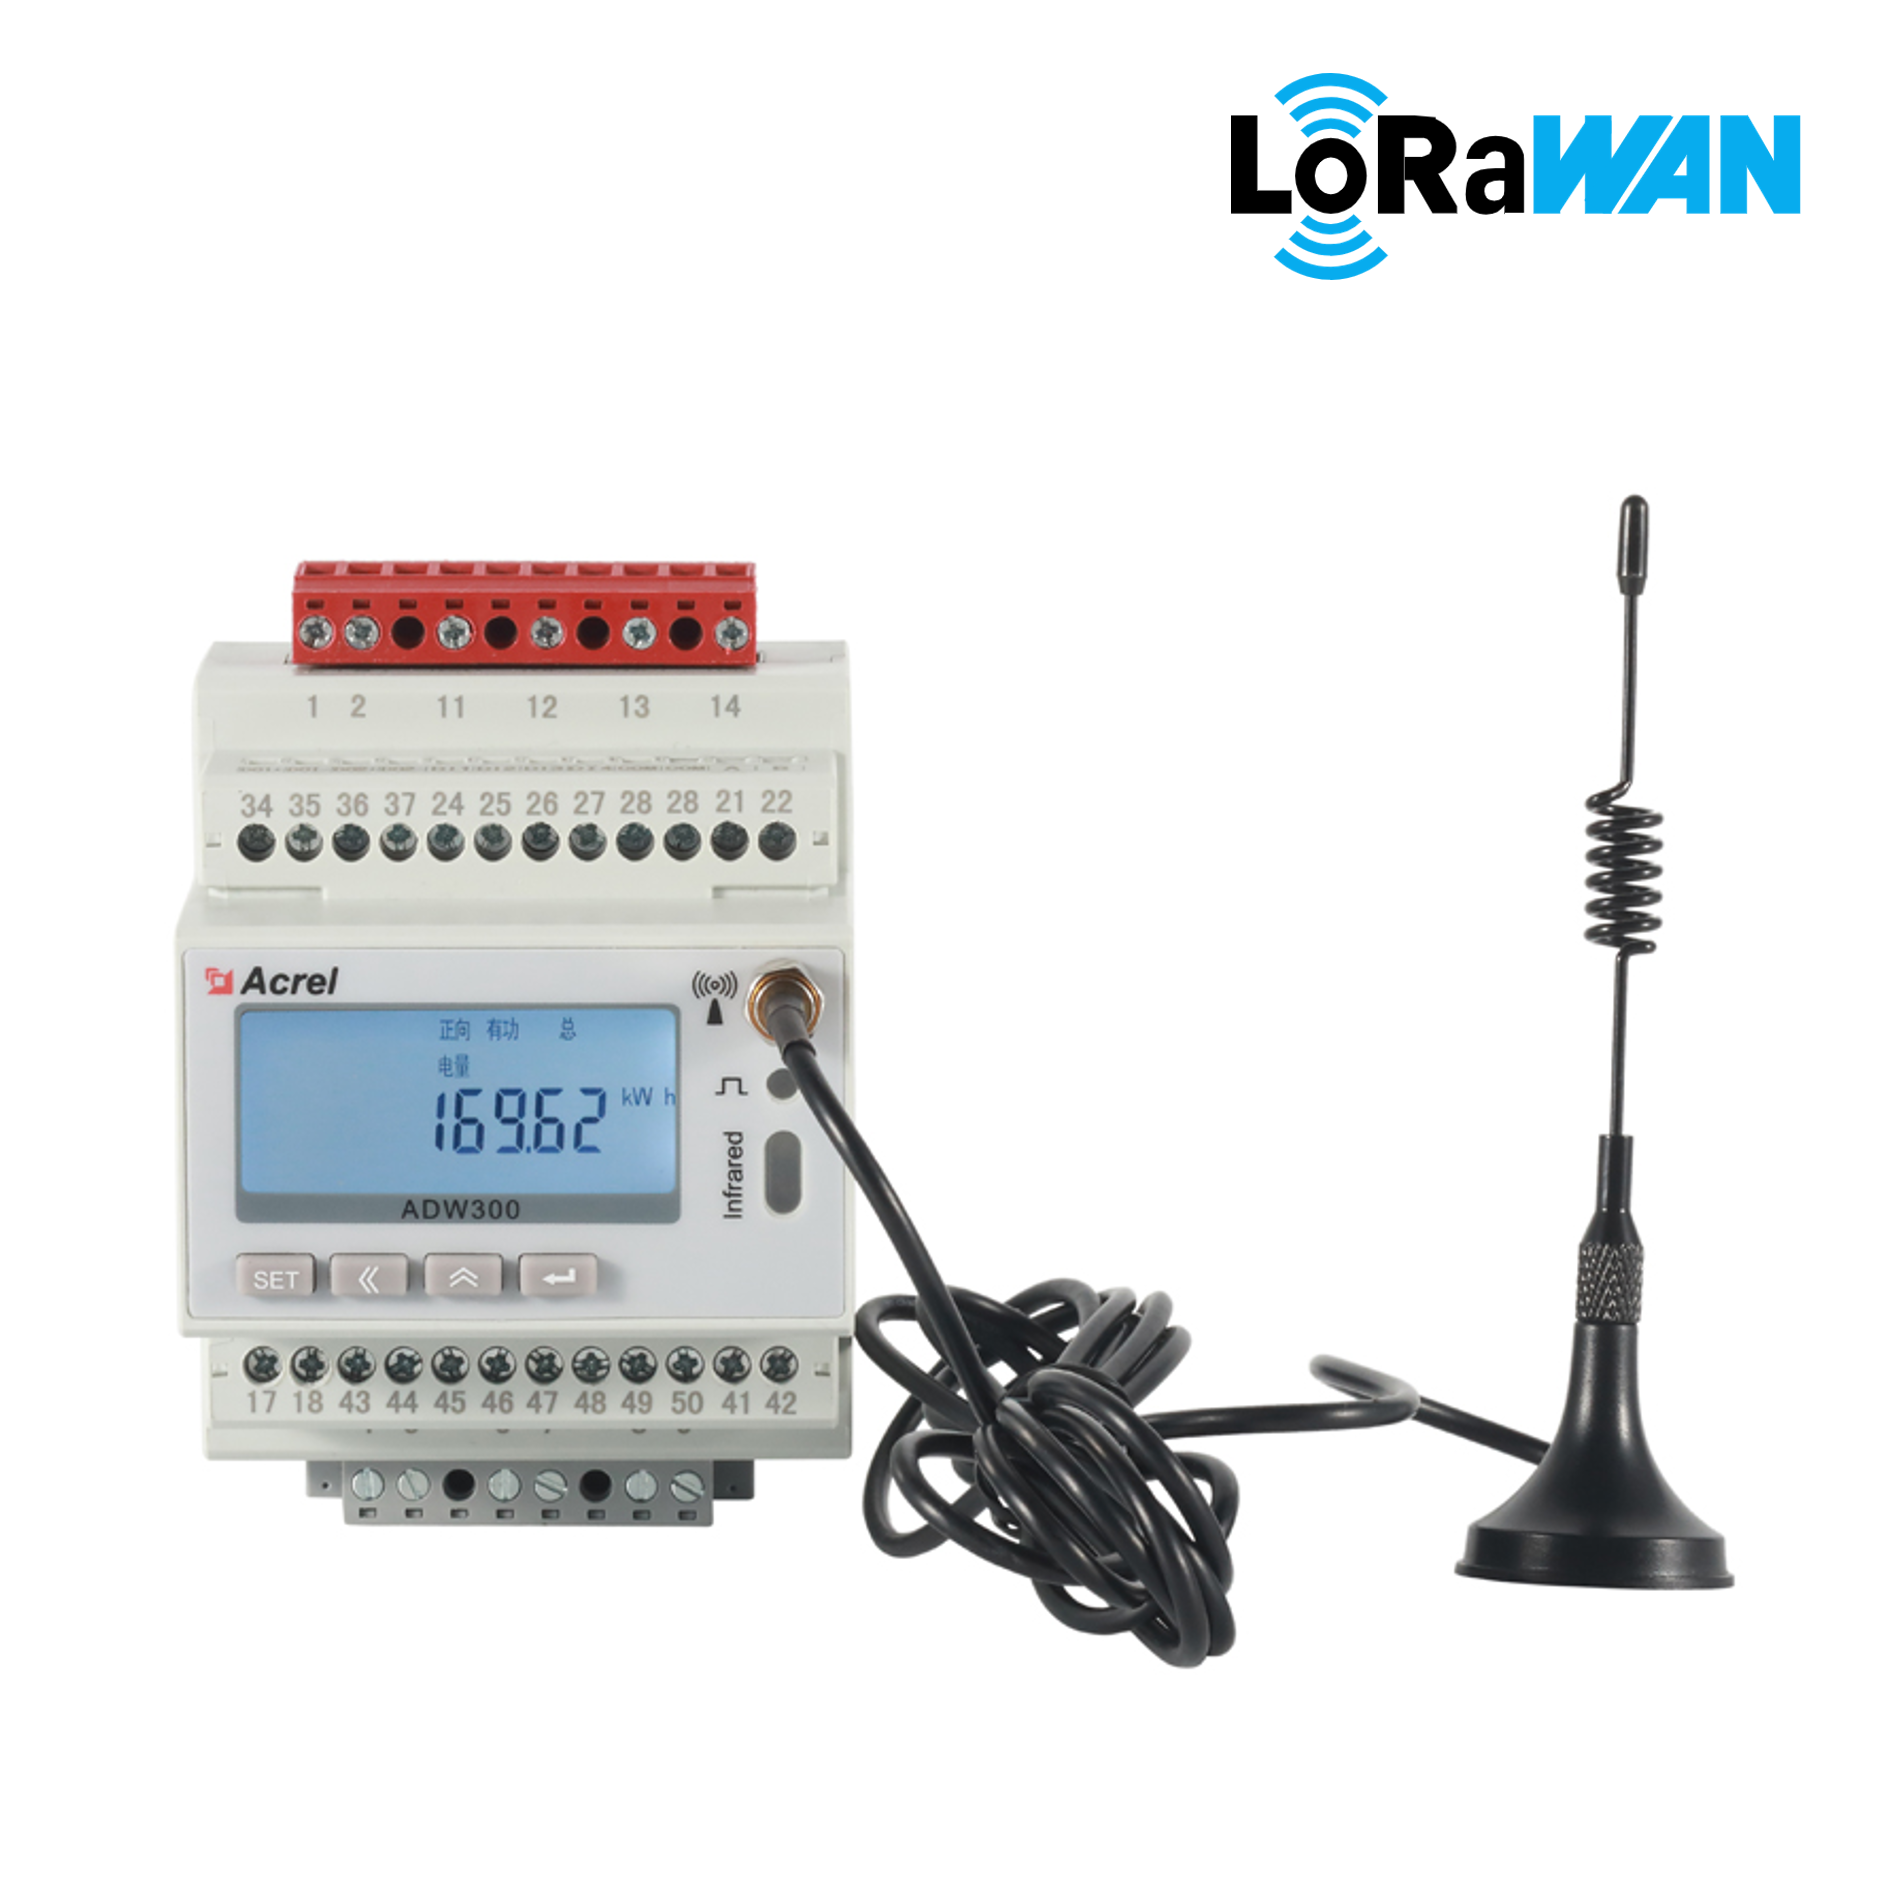
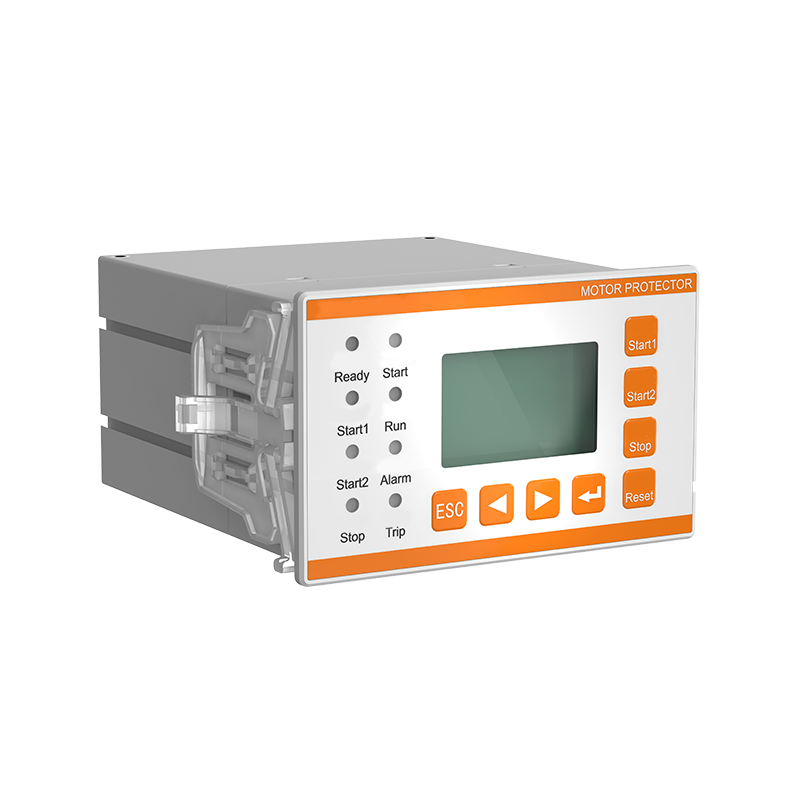
A compact wireless metering node installed alongside the main distribution panel
Because this class of meter reports over Wi-Fi or a local gateway rather than requiring a technician to read a physical display, the same granular data becomes available remotely, which matters most when a system owner is trying to confirm generation figures without a truck roll.
A wireless metering deployment is a short chain of handoffs, and understanding it helps explain why installation is simpler than it looks. Current and voltage are sensed at the panel, converted to a digital reading inside the meter, then pushed over a local wireless link to a gateway that forwards it to a cloud dashboard or mobile app.
Most residential deployments rely on Modbus RTU or RS485 between the sensor and the meter, then Wi-Fi or a cellular module for the last hop to the cloud, which avoids running new low-voltage cable through finished walls. Alert thresholds, such as a sudden export drop during peak sun hours, can then be evaluated server-side and pushed to a phone within seconds rather than being noticed weeks later on a utility bill.
The meter's display logic is only as good as the raw signal it receives, and that signal quality is set by the power sensors feeding it. Three sensing technologies dominate residential and light-commercial installs, each with a different accuracy and installation trade-off.
| Sensor Type | Typical Error Margin | Installation Note |
|---|---|---|
| Split-Core Current Transformer | 1.0 percent | Clamps around existing wire, no disconnection needed |
| Solid-Core Current Transformer | 0.5 percent | Higher accuracy, requires wire to be disconnected first |
| Rogowski Coil | 1.0 to 1.5 percent | Flexible, ideal for tight panel spacing |
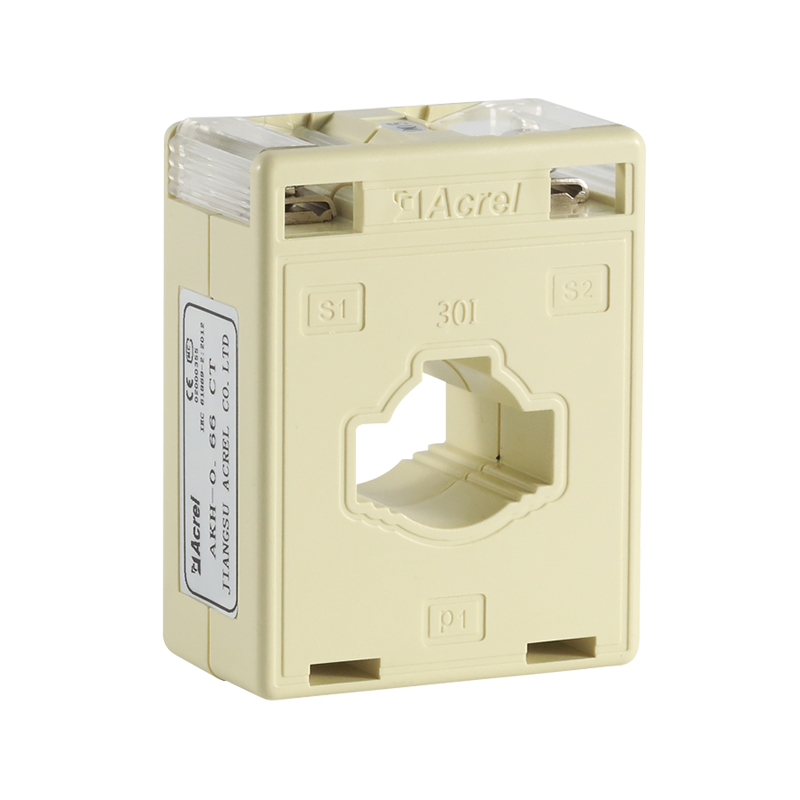
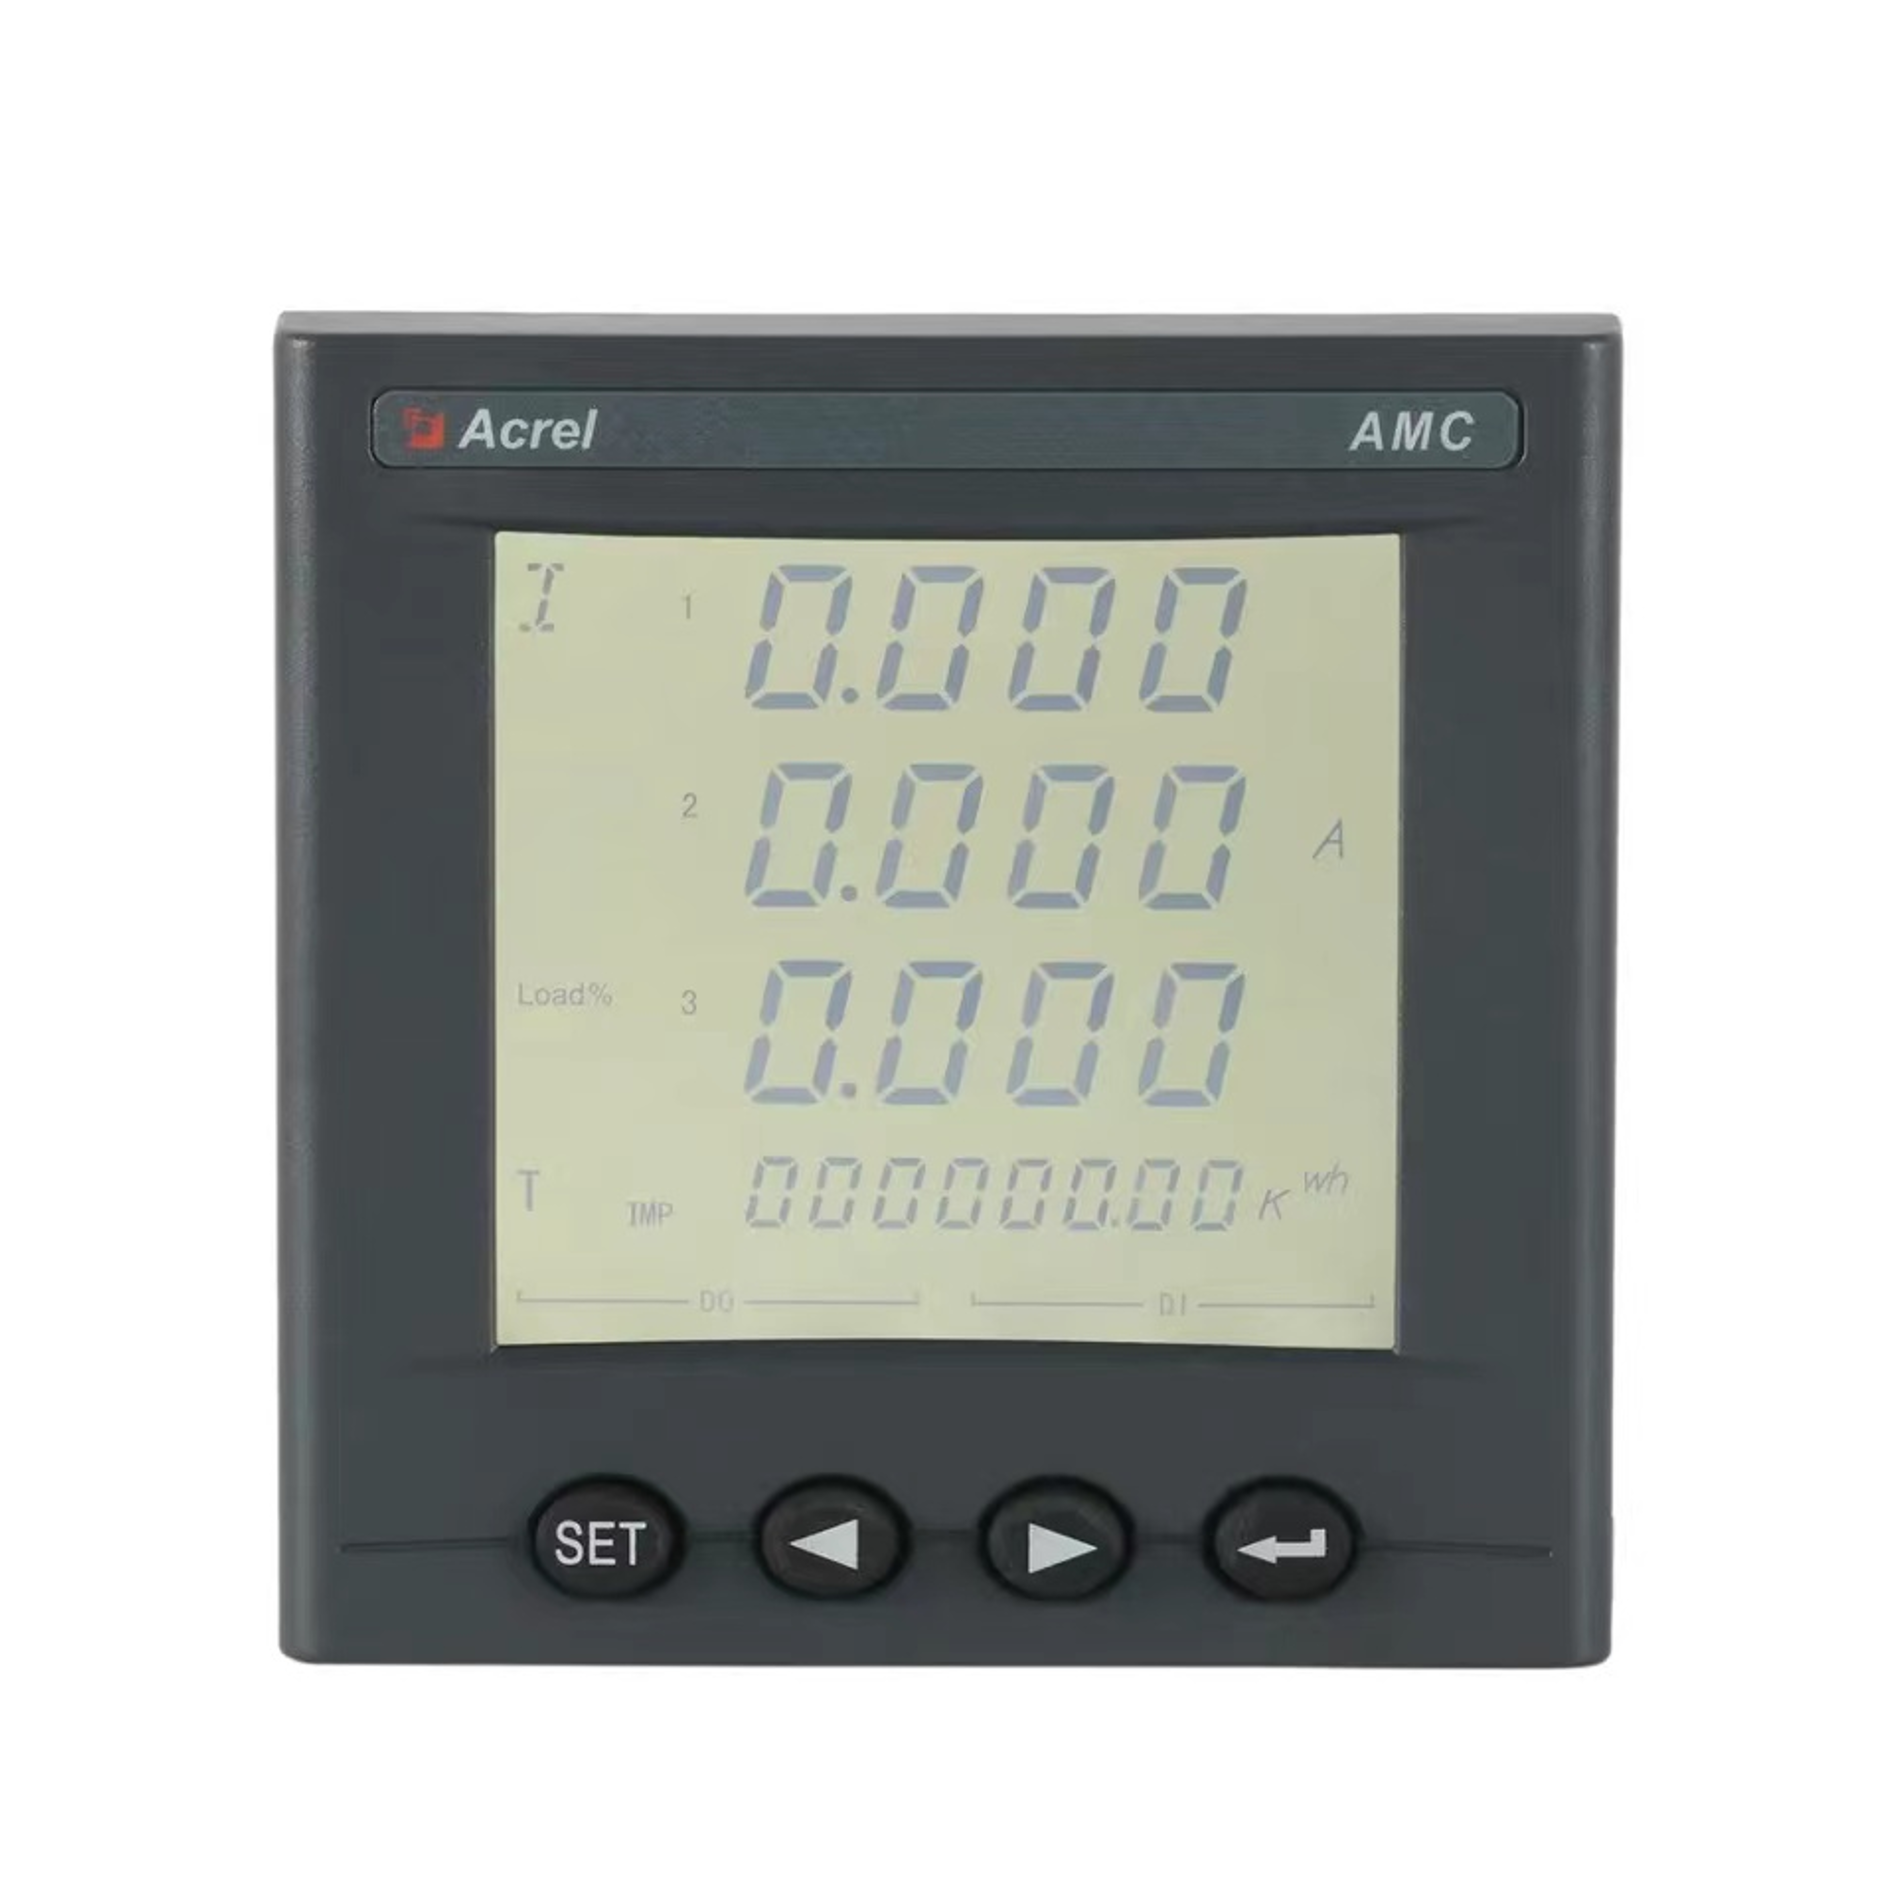
A current sensor paired with the meter to isolate readings per circuit
Temperature drift is the quiet source of error that specification sheets often understate. A sensor rated for a narrow lab temperature range can read noticeably differently in a hot attic run than in a shaded garage panel, so sensors intended for outdoor-adjacent enclosures should carry a stated operating range of at least minus 25 to 70 degrees rather than a typical indoor-only rating.
Net metering credit accuracy depends entirely on correctly separating exported energy from consumed energy at every timestamp, not just at the monthly total. Utility settlement disputes usually trace back to a monitoring gap during the exact hours when export is highest, typically midday, which is also when a coarse or delayed reading distorts the number the most.
Note how the gap between the two lines widens near solar noon, precisely the window with the largest export volume and therefore the largest financial swing if that data point is wrong. Precision metering closes that gap and gives both the homeowner and the utility a matching, auditable number.
No single monitoring method wins on every dimension, but the trade-offs become clear once accuracy, visibility, fault detection, ease of installation, and data granularity are placed on the same scale.
The inverter display remains useful as a first glance, and a standalone meter closes some of the gap on accuracy, but only a wireless node with dedicated sensors covers all five dimensions well enough to support both diagnostics and billing at the same time.
Collecting data is easy; using it consistently is the harder part. A monitoring setup only earns its keep when it feeds a routine, not just a dashboard nobody opens after the first week.
Households running battery storage alongside solar benefit even more from granular data, since charge and discharge cycles need to be separated from grid import and solar export to see whether the battery is actually reducing peak-rate consumption or simply cycling without measurable savings.
A dedicated meter built to a 0.5 or 1.0 accuracy class typically narrows the reporting error to well under two percent, compared to inverter displays that can drift by five percent or more under real-world conditions.
In most cases no. Split-core current sensors clamp around existing conductors without disconnection, so installation is largely limited to mounting the meter and connecting it to a local Wi-Fi network.
Yes, when current and voltage are tracked per string or per branch circuit, a gradual efficiency decline shows up in the data days or weeks before it becomes noticeable on a monthly bill.
It is necessary for any system participating in net metering, since import and export need to be recorded separately for the utility to calculate credits accurately.
An annual check against a known load is generally sufficient for residential use, though systems in high-temperature environments benefit from a semi-annual check due to greater thermal drift exposure.


 Email: [email protected]
 Phone: +86-18702106858 / +86-21-69156352
No.253 Yulv Road, Jiading District, Shanghai, PRC 201801





